Fig. 5
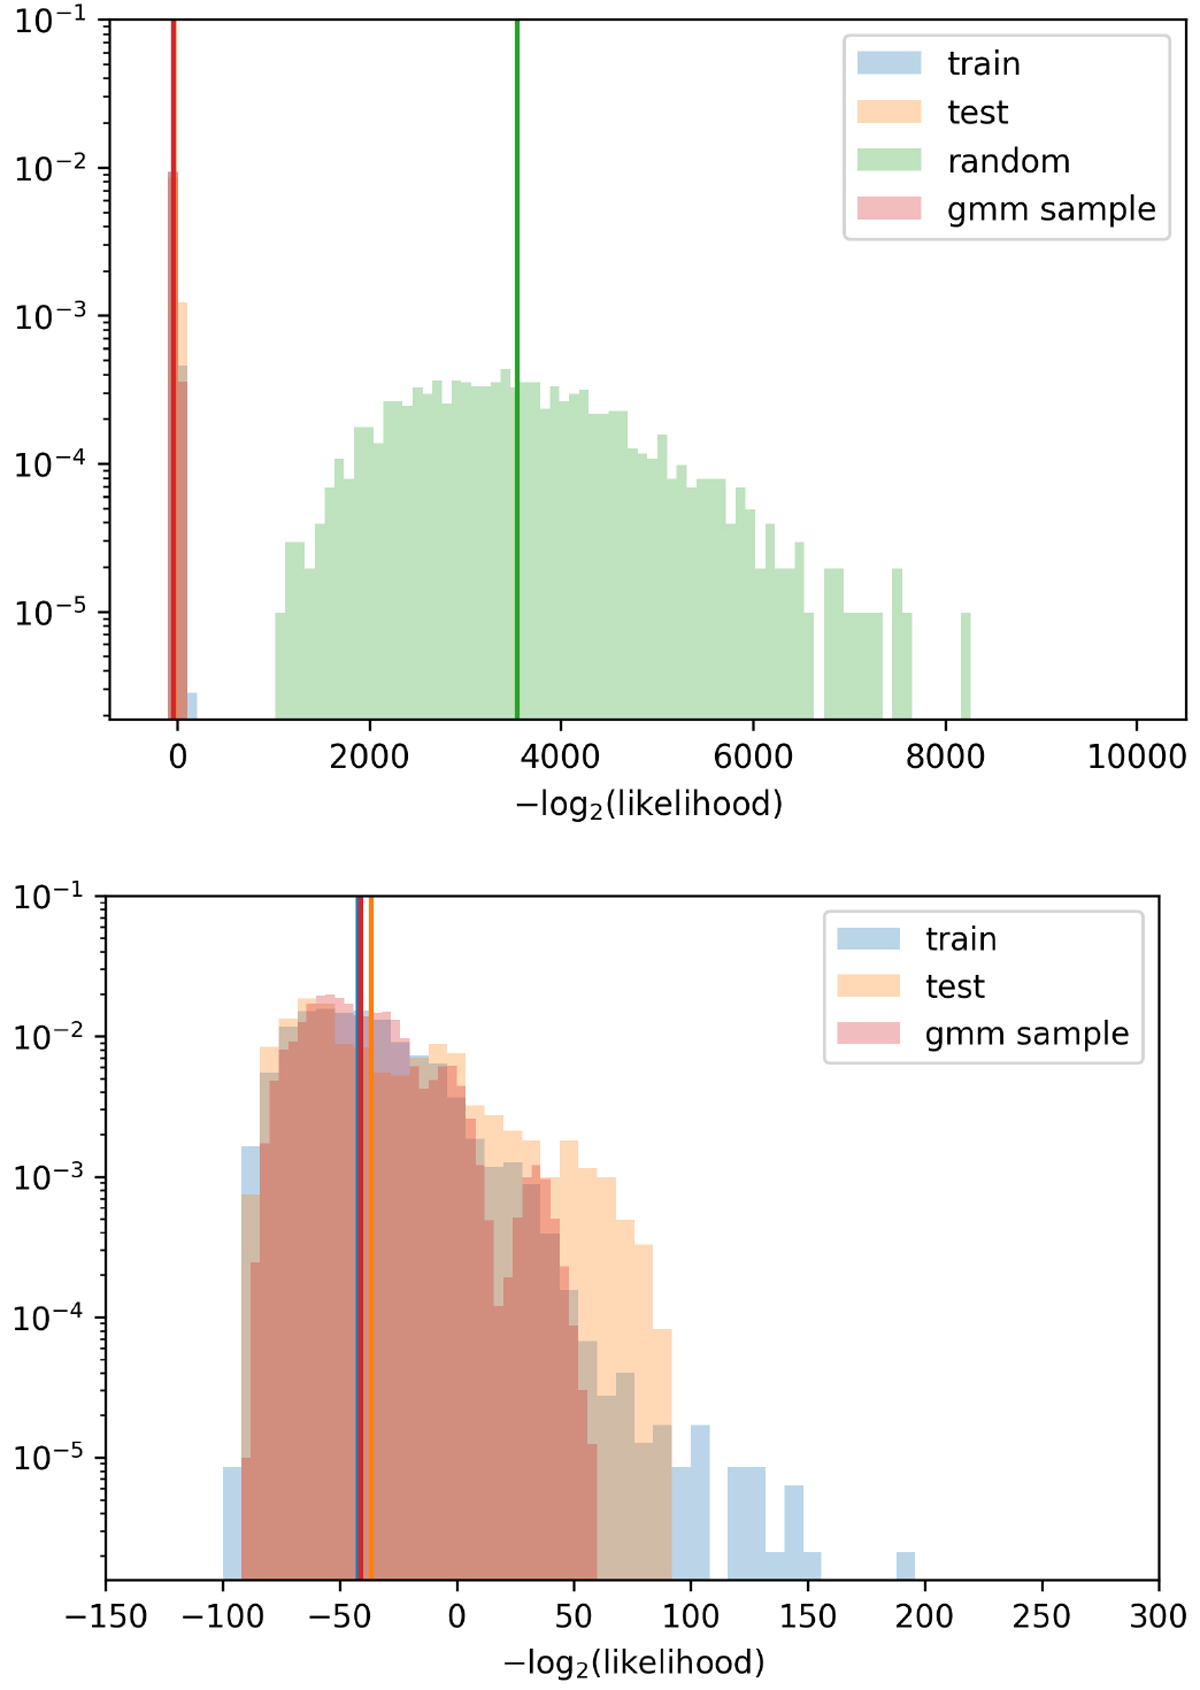
Probability distribution function of the value of the Gaussian mixture fitted on the training set, for each data point. The log2-likelihood shown on the horizontal axis can be interpreted as the number of bits (to within a constant value) required to encode each point of the sample. The blue, orange, green, and pink colors show the distributions for the training set, the test set, a set of points uniformly drawn in the same multi-dimensional space, and a set of points randomly drawn in the Gaussian Mixture, respectively. The vertical lines show the associated means of the negative log2 -likelihood. Bottom panel: zoom of the top one.
Current usage metrics show cumulative count of Article Views (full-text article views including HTML views, PDF and ePub downloads, according to the available data) and Abstracts Views on Vision4Press platform.
Data correspond to usage on the plateform after 2015. The current usage metrics is available 48-96 hours after online publication and is updated daily on week days.
Initial download of the metrics may take a while.