Fig. 19
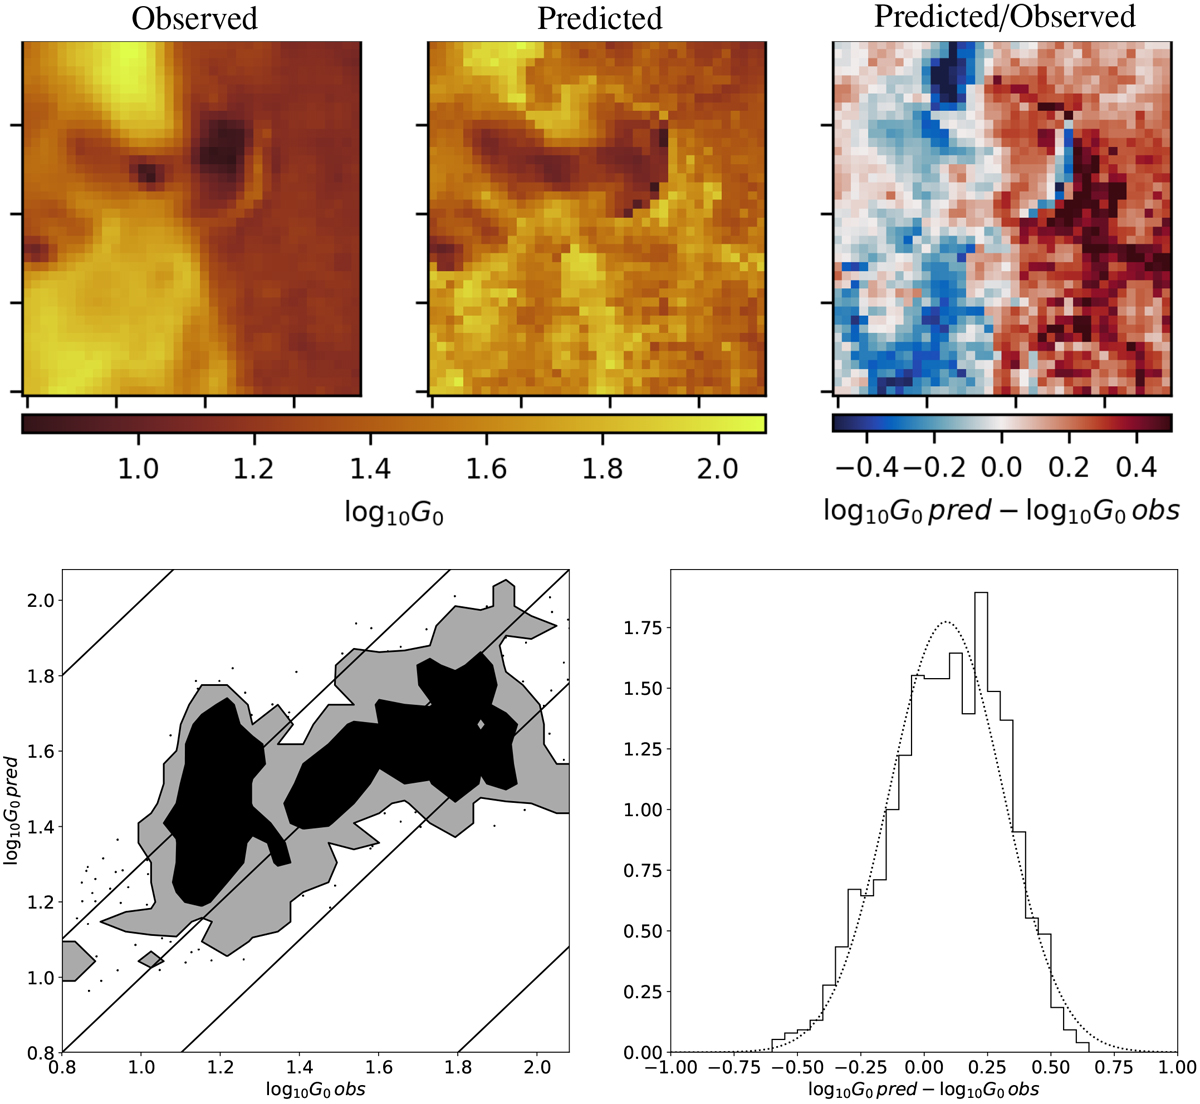
Top: spatial distribution of the observed and predicted far-UV illumination (left and middle panels), and of the ratio of the predicted illumination over the observed one (right panel). Bottom: joint histogram of the predicted illuminationas a function of the observed one (left panel), and histogram of the ratio of the predicted illumination over the observed one on a logarithmic scale. These results are computed on the Horsehead pillar, i.e., the test set.
Current usage metrics show cumulative count of Article Views (full-text article views including HTML views, PDF and ePub downloads, according to the available data) and Abstracts Views on Vision4Press platform.
Data correspond to usage on the plateform after 2015. The current usage metrics is available 48-96 hours after online publication and is updated daily on week days.
Initial download of the metrics may take a while.