Fig. 1
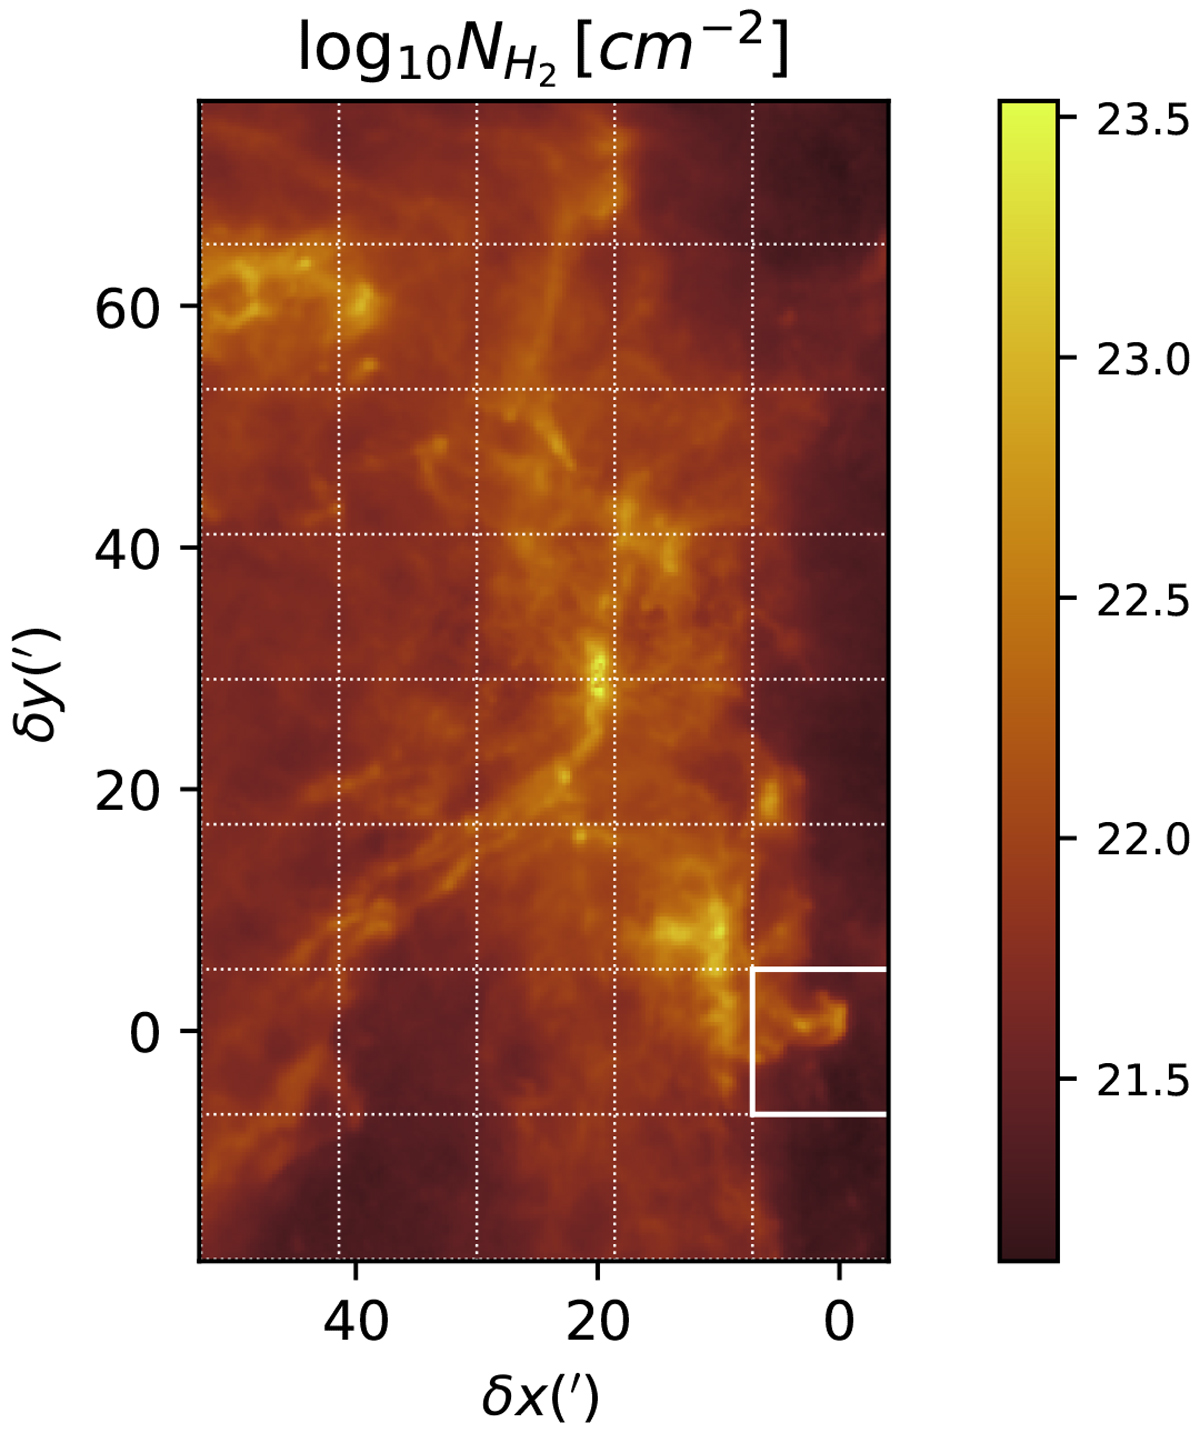
Spatial distribution of the dust-traced H2 column density derived from Herschel data (André et al. 2010; Lombardi et al. 2014). The dotted grid is used to define the training and test sets. The white square in the bottom right around the Horsehead region corresponds to the test set where the random forest predictions will be compared to the observations. This subset is never used during the training phase. Only the remainder of the map is used as the training set.
Current usage metrics show cumulative count of Article Views (full-text article views including HTML views, PDF and ePub downloads, according to the available data) and Abstracts Views on Vision4Press platform.
Data correspond to usage on the plateform after 2015. The current usage metrics is available 48-96 hours after online publication and is updated daily on week days.
Initial download of the metrics may take a while.