Fig. 8.
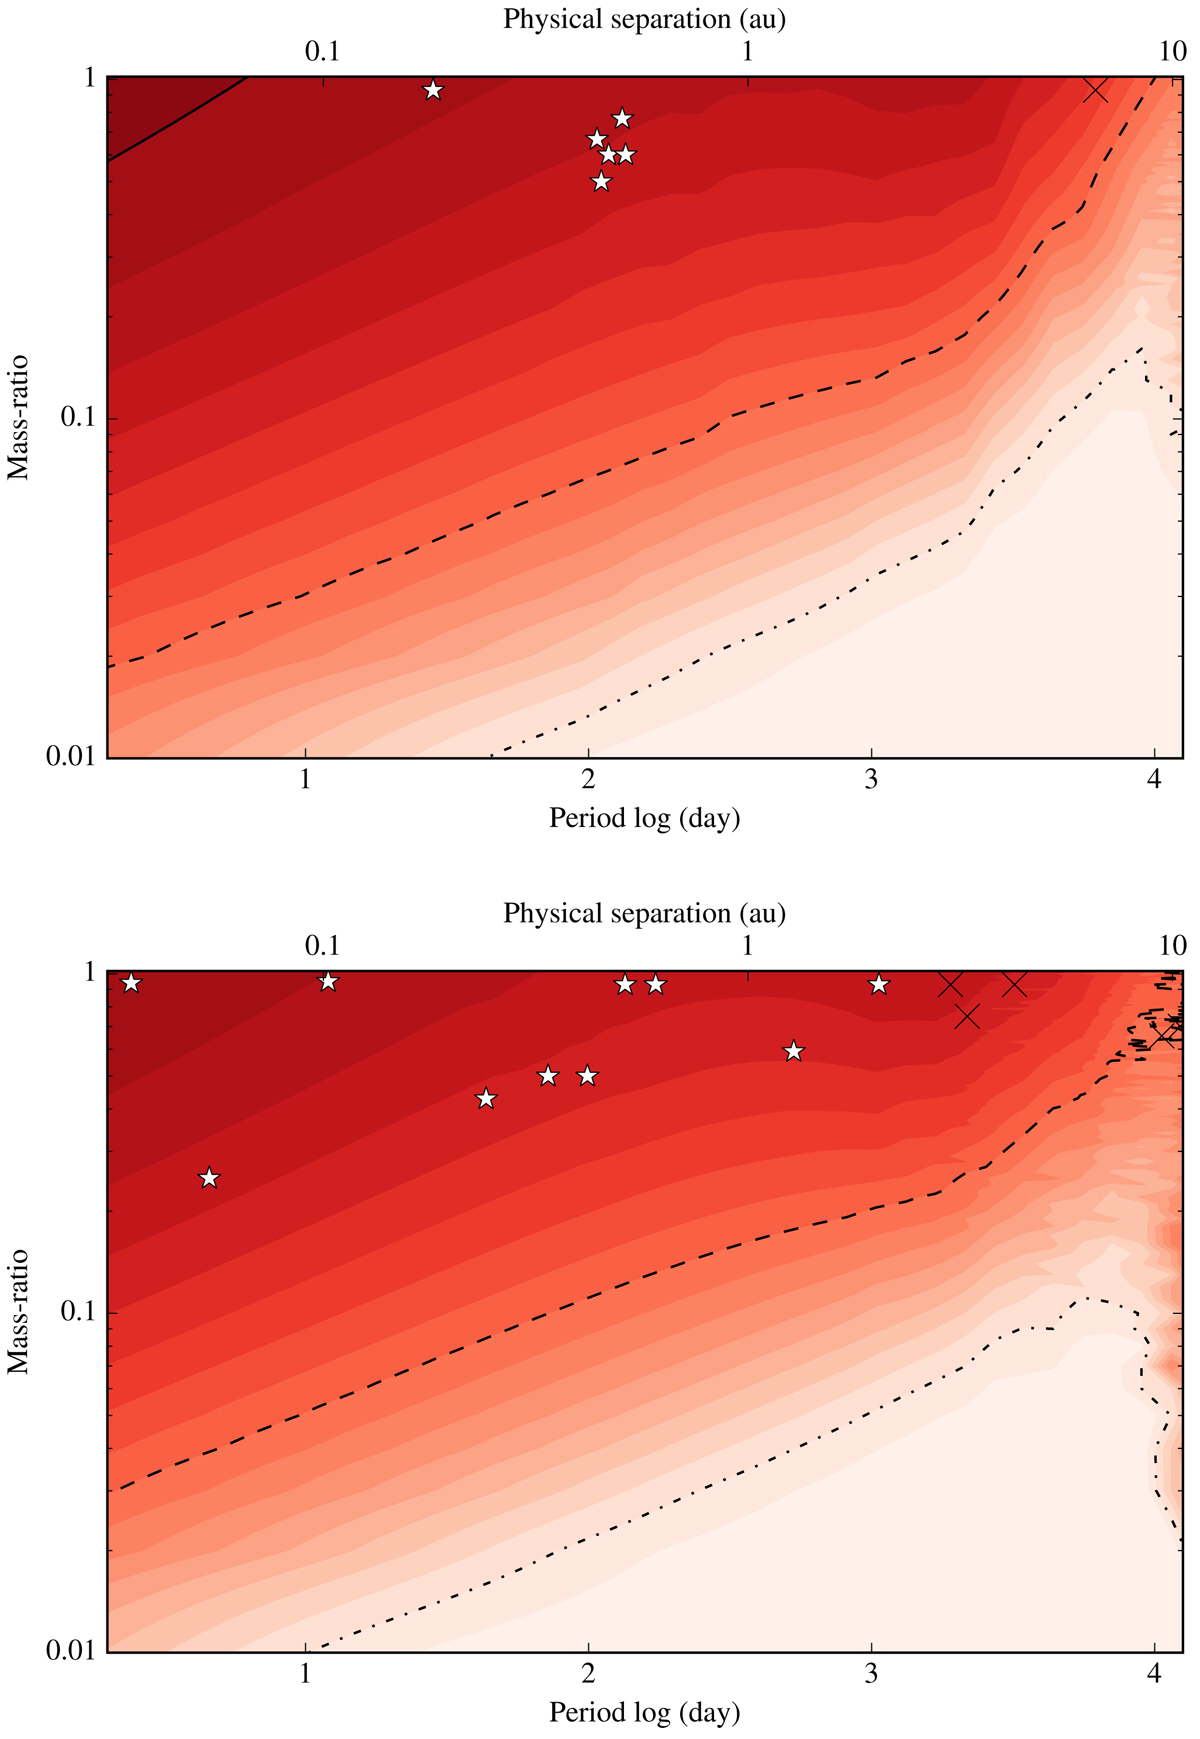
Upper panel: average detection probabilities for THA association (contours from red, 100%, to white, 0%), detected spectroscopic companions (white stars) and visual binaries (black crosses) in the physical separation versus mass ratio. The solid, dashed and dash-dotted lines encompass areas with detection probabilities ≥90%, 50%, and 10 %, respectively. Bottom panel: same as upper panel, but for BPC association.
Current usage metrics show cumulative count of Article Views (full-text article views including HTML views, PDF and ePub downloads, according to the available data) and Abstracts Views on Vision4Press platform.
Data correspond to usage on the plateform after 2015. The current usage metrics is available 48-96 hours after online publication and is updated daily on week days.
Initial download of the metrics may take a while.