Fig. 4.
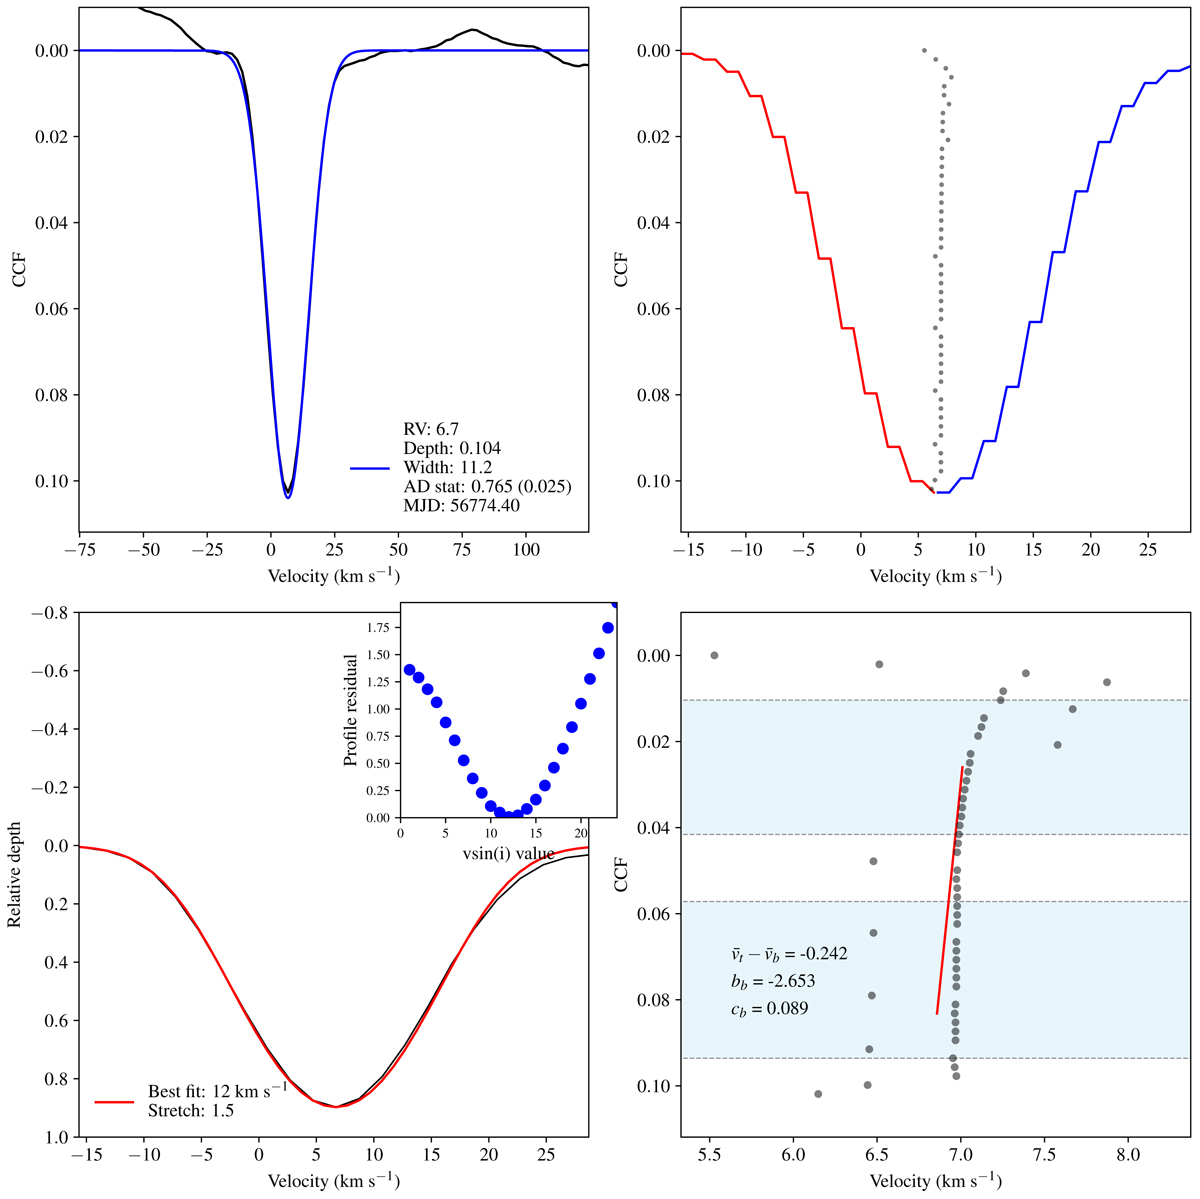
Example of the graphical output from our CCF calculation code for one target. Top left: CCF profile. The quantities shown in the lower left are the peak of the fitted Gaussian profile (RV), the depth of the CCF, the width (σ) of the Gaussian profile, the Anderson-Darling statistic for normality between −σ and +σ with its respective significance level, and the MJD of the observation. Top right: 2σ region of the CCF profile and the bisector (grey dots). Bottom left: normalised CCF-fitted with the best-fit rotational profile (from profiles in the v sin i range 1–200 km s−1). The residuals of fits are shown in the inset. Bottom right: bisector slope along with three metrics of its shape (bb, cb and BIS). See text in Sects. 4 and 5 for further details.
Current usage metrics show cumulative count of Article Views (full-text article views including HTML views, PDF and ePub downloads, according to the available data) and Abstracts Views on Vision4Press platform.
Data correspond to usage on the plateform after 2015. The current usage metrics is available 48-96 hours after online publication and is updated daily on week days.
Initial download of the metrics may take a while.