Fig. F.1.
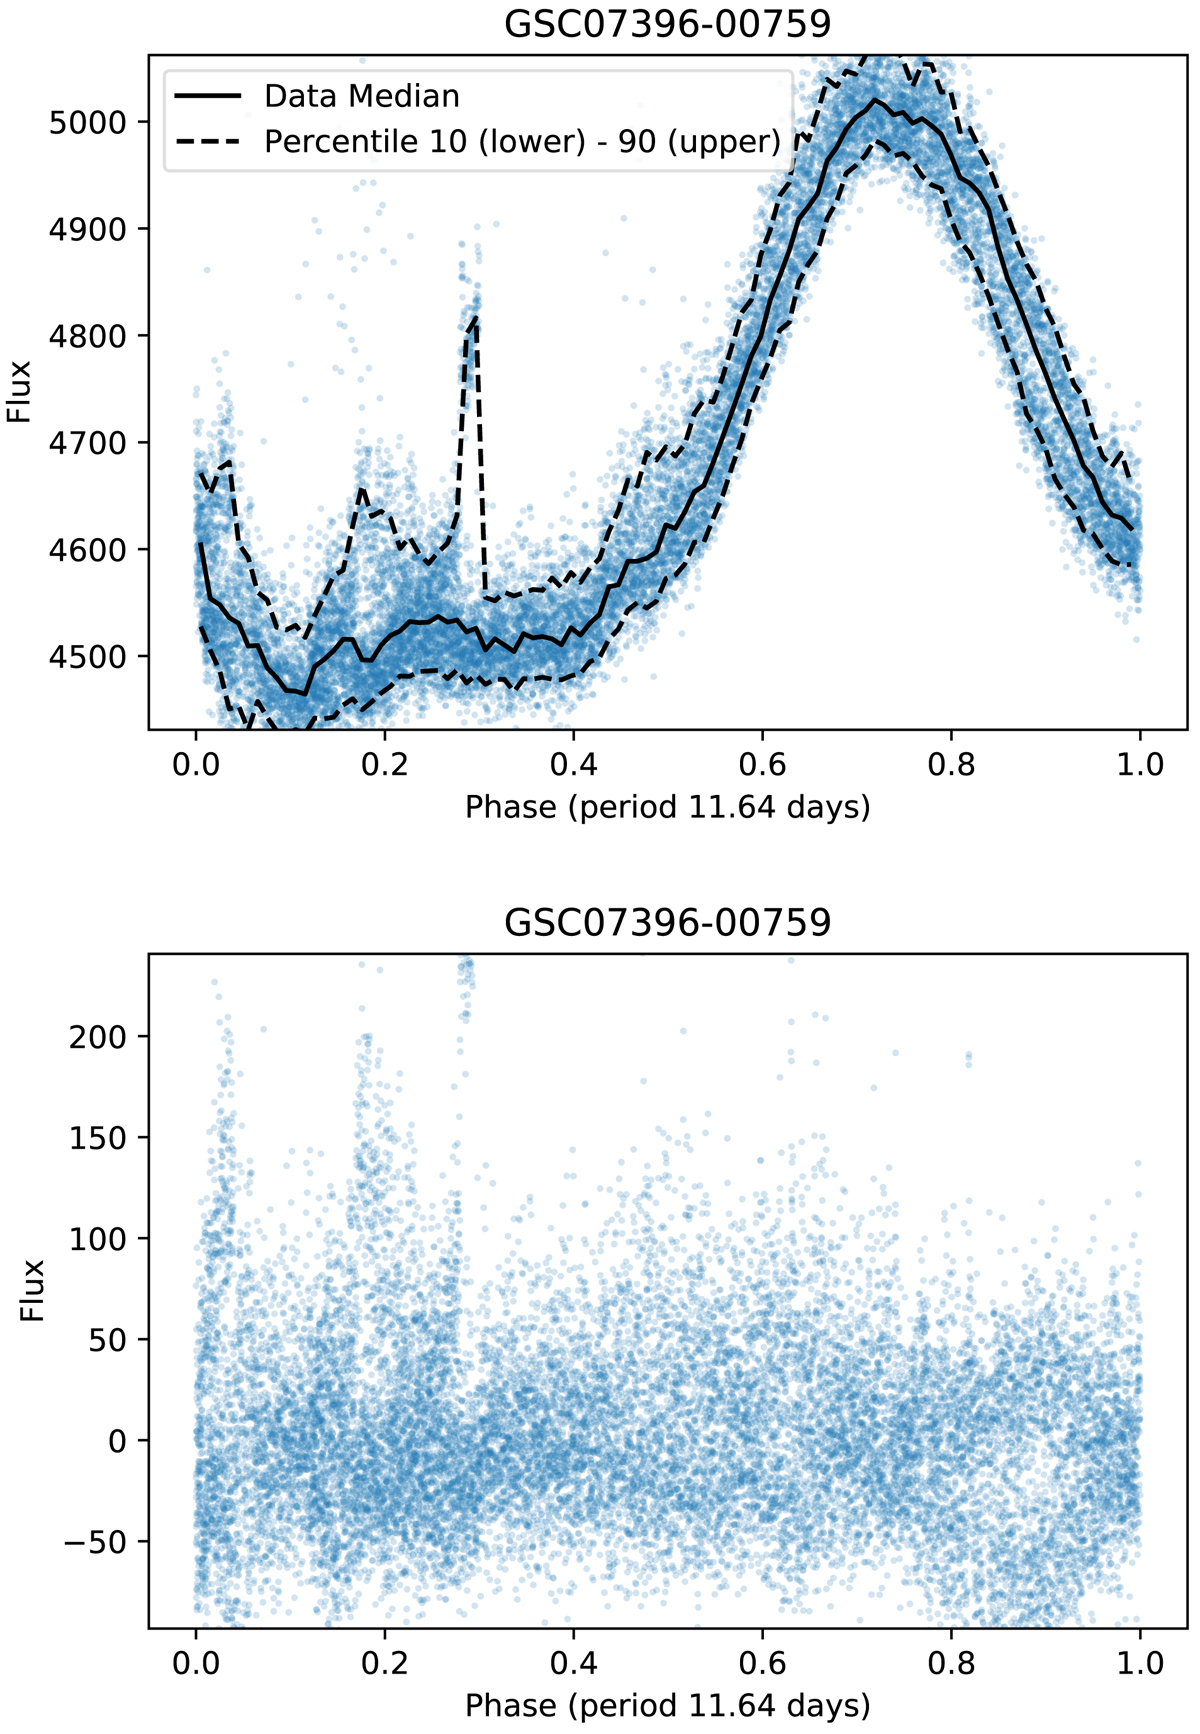
Upper panel: phased light curve for GSC 07396-00759. The solid line represent the median calculated by binning the phased curve in 100 bins. The MAD for the phased curve for this object is 652.67. Bottom panel: residuals from subtracting light curve values from the “median model” (solid line). The MAD of the residuals is 121.84.
Current usage metrics show cumulative count of Article Views (full-text article views including HTML views, PDF and ePub downloads, according to the available data) and Abstracts Views on Vision4Press platform.
Data correspond to usage on the plateform after 2015. The current usage metrics is available 48-96 hours after online publication and is updated daily on week days.
Initial download of the metrics may take a while.