Fig. D.1.
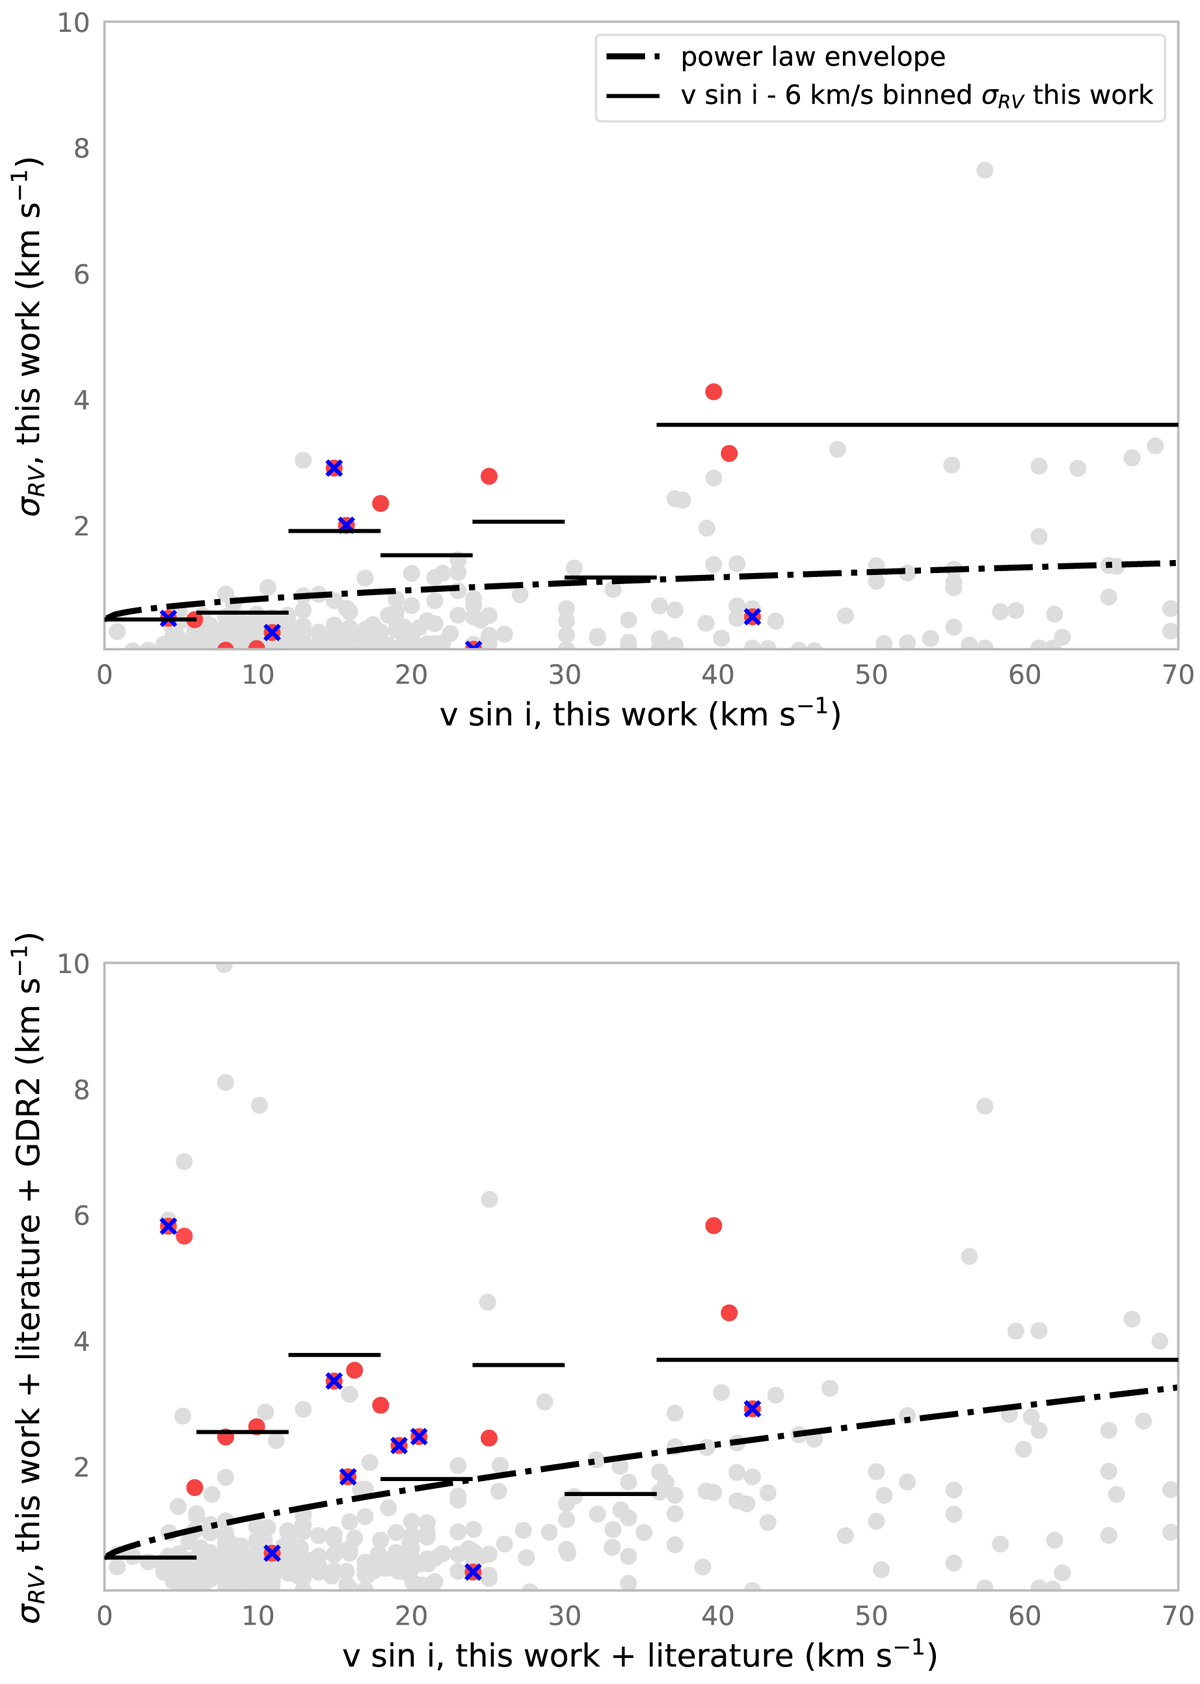
Upper panel: standard deviation in RV as a function of v sin i for measurements calculated in this work. The 3σ value from binning in 6 km s−1 bins are represented by the solid lines. The power law envelope is represented by dash-dotted line. The SB1s identified in this work are plotted as a red dots and the previously identified SB1s from literature are represented as a blue crosses. Bottom panel: same as upper panel but including values from literature and Gaia DR2. Some SB1 were confirmed only when literature values were included (red dots under the 3σ envelope in upper panel). Details on each candidate can be found in Appendix A.
Current usage metrics show cumulative count of Article Views (full-text article views including HTML views, PDF and ePub downloads, according to the available data) and Abstracts Views on Vision4Press platform.
Data correspond to usage on the plateform after 2015. The current usage metrics is available 48-96 hours after online publication and is updated daily on week days.
Initial download of the metrics may take a while.