Free Access
Fig. B.3.
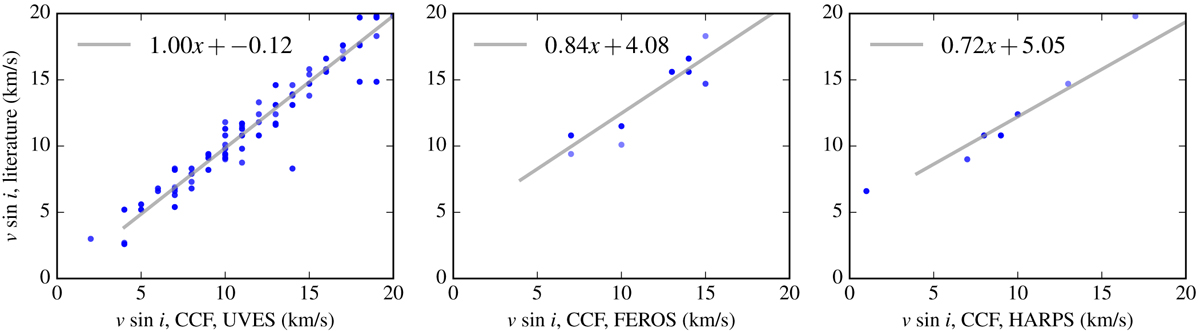
v sin i values from fitted rotational profiles versus literature v sin i values. The left, middle and right panels show measurements for UVES, FEROS and HARPS observations. The linear relation (y = mx + c) is shown for each set of measurements.
Current usage metrics show cumulative count of Article Views (full-text article views including HTML views, PDF and ePub downloads, according to the available data) and Abstracts Views on Vision4Press platform.
Data correspond to usage on the plateform after 2015. The current usage metrics is available 48-96 hours after online publication and is updated daily on week days.
Initial download of the metrics may take a while.