| Issue |
A&A
Volume 645, January 2021
|
|
|---|---|---|
| Article Number | C2 | |
| Number of page(s) | 2 | |
| Section | Atomic, molecular, and nuclear data | |
| DOI | https://doi.org/10.1051/0004-6361/202037821e | |
| Published online | 13 January 2021 | |
Rotational relaxation of H2S by collision with He (Corrigendum)
1
Núcleo de Astroquímica y Astrofísica, Instituto de Ciencias Químicas Aplicadas, Facultad de Ingeniería, Universidad Autónoma de Chile,
Av. Pedro de Valdivia 425, Providencia, Santiago,
Chile
e-mail: This email address is being protected from spambots. You need JavaScript enabled to view it.
2
Institut des Sciences Moléculaires, Université de Bordeaux, CNRS UMR 5255,
33405 Talence Cedex, France
e-mail: This email address is being protected from spambots. You need JavaScript enabled to view it.
Key words: astrochemistry / molecular data / molecular processes / scattering / ISM: molecules / errata, addenda
This is a corrigendum to Denis-Alpizar & Stoecklin (2020). Owing to an interface error in the implementation of the potential energy surface in the Newmat dynamics code, the cross sections and rate coefficients presented in Figs. 3, 4, and 5 and discussed in Sect. 3.2 of Denis-Alpizar & Stoecklin (2020), regarding the dynamics, appear to be significantly wrong and are replaced by the new Figs. 1, 2, and 3, respectively. The new cross sections and rate coefficients are of the same order of magnitude as the previous ones, but the sorting and the structures of the curves associated with different transitions are hardly comparable to the previous ones. As is detailed below, the main conclusions of our original manuscript remain, however, unchanged.
The (Kc = 0) propensity rule mentioned in our original manuscript, which results from the fact that H2S is a near oblate symmetric top, remains visible in Figs. 1 and 2 and it still becomes increasingly rigorous as j and the collision energy both increase. The transitions towards the levels the closest in energy to the initial one and associated with the lowest (Δj = 0 or 1) also give the largest cross sections, as noted previously. Conversely, the conservation of the parity index is not observable anymore for the lowest values of j, but it still appears to give the largest cross sections as j and the collision energy both increase.
The comparison of our new results with the only experimental data available for this system appear to be quite a bit more satifactory than before. Indeed, our calculated value for the depopulation rate coefficient rate of the 110 level of H2S at 11.1 K is now about 1.75 times larger (3.06 × 10⁻¹¹ cm3 molecule−1 s−1) than the one reported by Ball et al. (1999) (1.75 × 10⁻¹¹ cm3 molecule−1 s−1), while our previous value was three times larger than the one from their experiment. It is also interesting to see that the value (4.0 × 10⁻¹¹ cm3 molecule−1 s−1) which can be obtained from the results of Dagdigian (2020) for the collision of H2S with H2 (5.6 × 10⁻¹¹ cm3 molecule−1 s−1) by using the mass scaling approximation  (Schöier et al. 2005) is also in fair agreement with our results.
If we now revisit in Fig. 3 the comparison we made previously between the H2 S + He and H2O + He collisional systems, the temperature dependences are now seen to be similar for these two systems while they used to differ in our previouscalculations. This result can be understood by reminding readers that the well depths of the two associated potential energy surfaces (PESs) are very close, while the ratio of the reduced masses of the two systems nearly equals one. Conversely, the magnitudes and the propensity rules are still quite different for some of the transitions as a result of both the differences in the angular anisotropies of the two PESs and in the rotational constants, H2 S being a nearly oblate symmetric top while H2O is a good example of an asymmetric top intermediate case. The important conclusion of our uncorrected manuscript stating that mass scaled He−H2O data cannot be used to obtain those for He+H2S then remains correct.
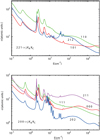 |
Fig. 1 Rotational de-excitation cross sections of H2S by collision with He. Upper and lower panels: transitions issued from the 2 2 1 and 2 2 0 initial levels of H2 S, respectively. |
The comparison, in the upper and lower panels of Fig. 3, of the rotational de-excitation rate coefficients of H2 S by collision with He from the initial states 2 2 1 and 2 2 0 of H2S with those recently published by Dagdigian (2020) for the collisions with H2 leads to similar conclusions as in our original paper. The rate coefficients for the two systems are still seen to differ both in the law variation as a function of temperature and in the propensity rules. Moreover, they now also differ more in magnitude than they previously did, and the explanations of these discrepancies remain the same: the well depth of the H2 –H2S complex (146.8 cm−1) calculated by Dagdigian (2020) is five times deeper than the one of He–H2S, while the relative masses of the former is about a half of the later. The general conclusion of our paper is then unchanged. The scaling law based on the square root of the inverse ratio of the relative masses is not a good option to predict the rate coefficients for the collisions of H2 S with pH2 from those with He, while the excitation rate coefficients with He need to be included in the modeling of the rotational excitation of H2 S. The new rates will soon be made available in the Basecol and Lambda database.
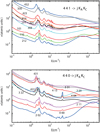 |
Fig. 2 Rotational de-excitation cross sections of H2S by collision with He. Upper and lower panels: transitions issued from the 4 4 1 and 4 4 0 initial levels of H2 S, respectively. |
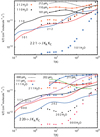 |
Fig. 3 Rotational de-excitation rate coefficients of H2S by collision with He. Upper and lower panels: transitions issued from the 2 2 1 and 2 2 0 initial levels of H2 S, respectively. The rates are compared with the corresponding ones for the H2S+pH2 collisions (designated by pH2) and with those for H2O+He collisions (designated by H2O). |
Acknowledgements
We thank Dr Alexandre Faure for providing us Molscat calculations using our PES which allowed checking the accuracy of our results.
References
- Ball, C. D., Mengel, M., De Lucia, F. C., & Woon, D. E. 1999, J. Chem. Phys., 111, 8893 [NASA ADS] [CrossRef] [Google Scholar]
- Dagdigian, P. J. 2020, J. Chem. Phys., 152, 074307 [NASA ADS] [CrossRef] [Google Scholar]
- Denis-Alpizar, O., & Stoecklin, T. 2020, A&A, 638, A31 [CrossRef] [EDP Sciences] [Google Scholar]
- Schöier, F. L., van der Tak, F. F. S., van Dishoeck, E. F., & Black, J. H. 2005, A&A, 432, 369 [NASA ADS] [CrossRef] [EDP Sciences] [Google Scholar]
© ESO 2021
All Figures
|
Fig. 1 Rotational de-excitation cross sections of H2S by collision with He. Upper and lower panels: transitions issued from the 2 2 1 and 2 2 0 initial levels of H2 S, respectively. |
| In the text | |
|
Fig. 2 Rotational de-excitation cross sections of H2S by collision with He. Upper and lower panels: transitions issued from the 4 4 1 and 4 4 0 initial levels of H2 S, respectively. |
| In the text | |
|
Fig. 3 Rotational de-excitation rate coefficients of H2S by collision with He. Upper and lower panels: transitions issued from the 2 2 1 and 2 2 0 initial levels of H2 S, respectively. The rates are compared with the corresponding ones for the H2S+pH2 collisions (designated by pH2) and with those for H2O+He collisions (designated by H2O). |
| In the text | |
Current usage metrics show cumulative count of Article Views (full-text article views including HTML views, PDF and ePub downloads, according to the available data) and Abstracts Views on Vision4Press platform.
Data correspond to usage on the plateform after 2015. The current usage metrics is available 48-96 hours after online publication and is updated daily on week days.
Initial download of the metrics may take a while.