Fig. 6.
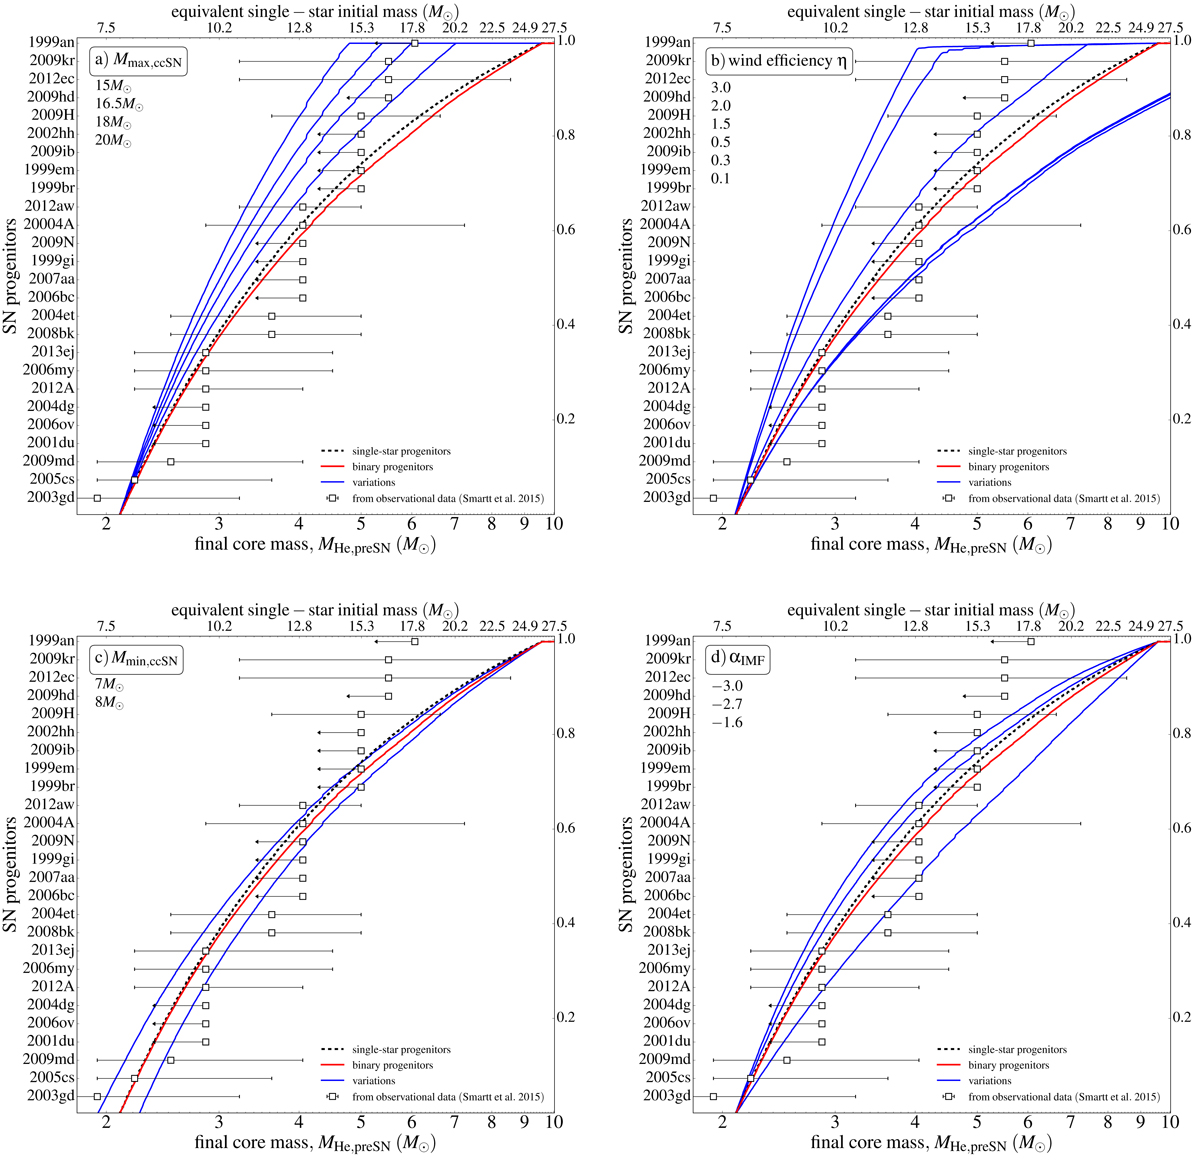
Same as Fig. 5 (with logarithmic x-axis here), but showing the results for other varying assumptions (blue lines): (a) the mass threshold for failed SN collapsing onto black holes Mmax, ccSN (Models 52, 53, 54 and 29), (b) the wind mass loss efficiency η (Models 25, 26 and 51), (c) the minimum mass for SN, Mmax, ccSN (Models 30 and 31) and (d) the slope of IMF αIMF (Models 32 to 34). These physical parameters influence the whole population, both single stars and in binary systems. The list of values depicted in the upper left corner shows a sequence of the varying distributions (blue lines) spanning from top left to bottom right of each panel.
Current usage metrics show cumulative count of Article Views (full-text article views including HTML views, PDF and ePub downloads, according to the available data) and Abstracts Views on Vision4Press platform.
Data correspond to usage on the plateform after 2015. The current usage metrics is available 48-96 hours after online publication and is updated daily on week days.
Initial download of the metrics may take a while.