Fig. 4.
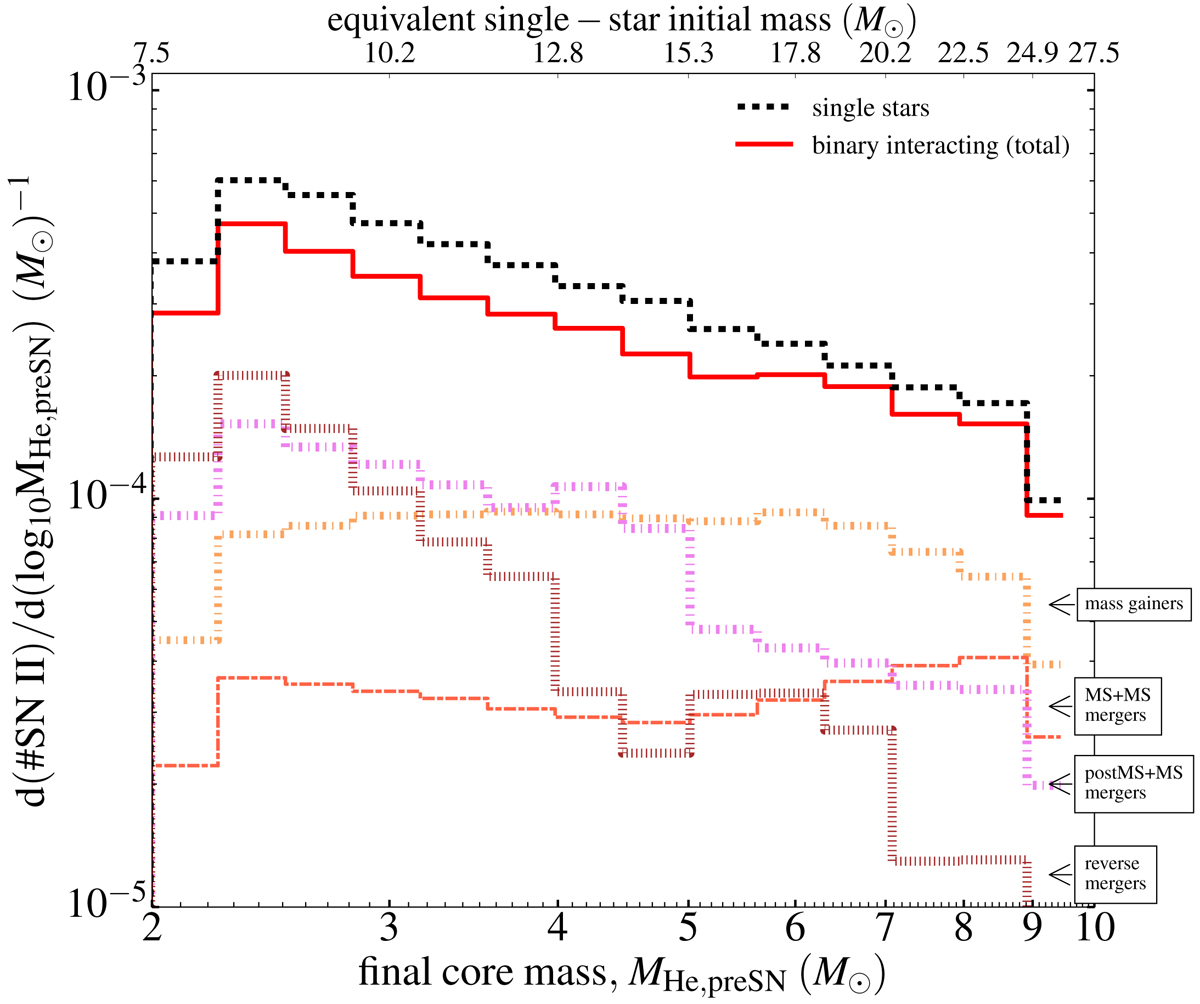
Distribution of the pre-SN helium core mass of SN II progenitors in case they experienced isolated evolution (black dashed line) or have followed a channel of binary interaction (red solid line). The contribution of each different binary scenario is also shown (dashed and/or dotted lines). The equivalent single-star initial masses corresponding to each MHe, preSN (inverse of Eq. (1)) is shown on the top x-axis. The results are for our standard assumptions and show the number of SN II per logarithmic bin in MHe, preSN per solar mass of star formation.
Current usage metrics show cumulative count of Article Views (full-text article views including HTML views, PDF and ePub downloads, according to the available data) and Abstracts Views on Vision4Press platform.
Data correspond to usage on the plateform after 2015. The current usage metrics is available 48-96 hours after online publication and is updated daily on week days.
Initial download of the metrics may take a while.