Fig. 2.
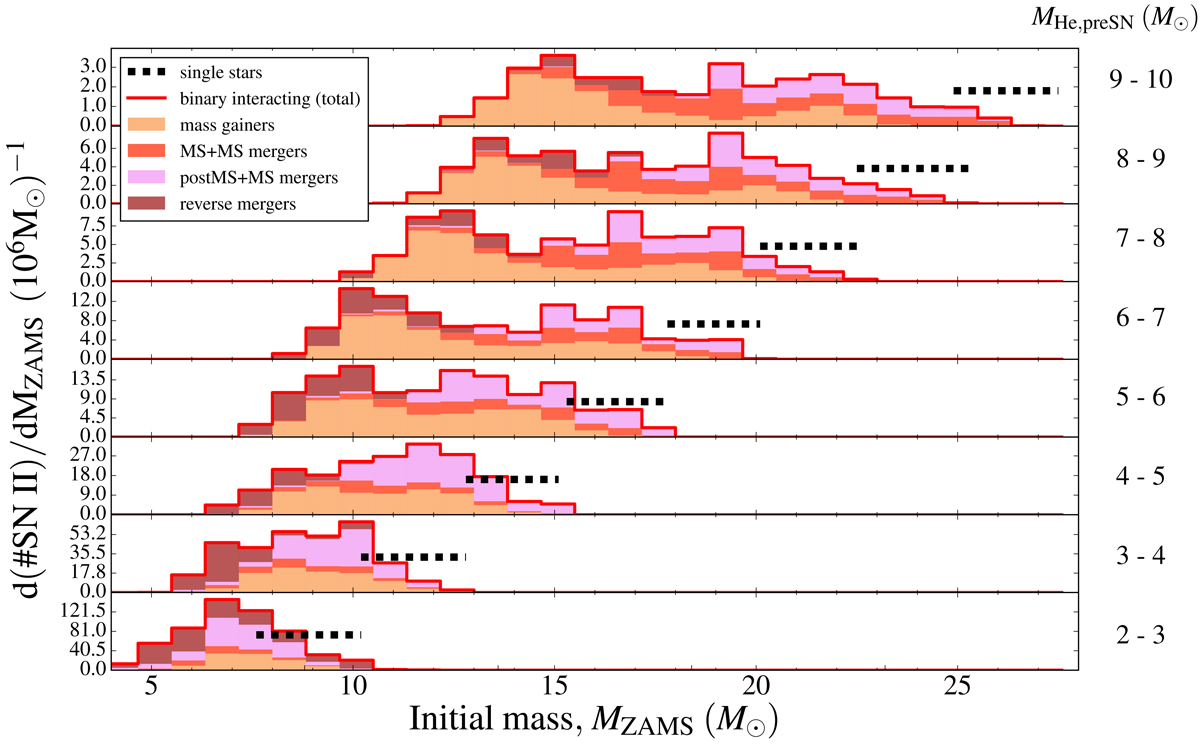
Distribution of initial masses, MZAMS, of SN II progenitors experiencing binary interaction (red line) for increasing ranges of final core masses, MHe, preSN (on the right part). The contribution of each of the main binary scenarios is also shown in color below the distribution of binary-interacted progenitors. For reference we include the initial mass range of a single star corresponding to each MHe, preSN bin (black dashed line), which is shown in an arbitrary height. It becomes clear that the binary progenitors of SN II can originate from a wider range of lower on average MZAMS compared to single stars to form cores of similar mass, due to mass accretion or merging during their evolution. The results are for our standard assumptions although similar trends are found in all our model variations. The values on the y-axis show the number of SN II per bin in MZAMS per 106 M⊙ of stars formed.
Current usage metrics show cumulative count of Article Views (full-text article views including HTML views, PDF and ePub downloads, according to the available data) and Abstracts Views on Vision4Press platform.
Data correspond to usage on the plateform after 2015. The current usage metrics is available 48-96 hours after online publication and is updated daily on week days.
Initial download of the metrics may take a while.