Fig. 4
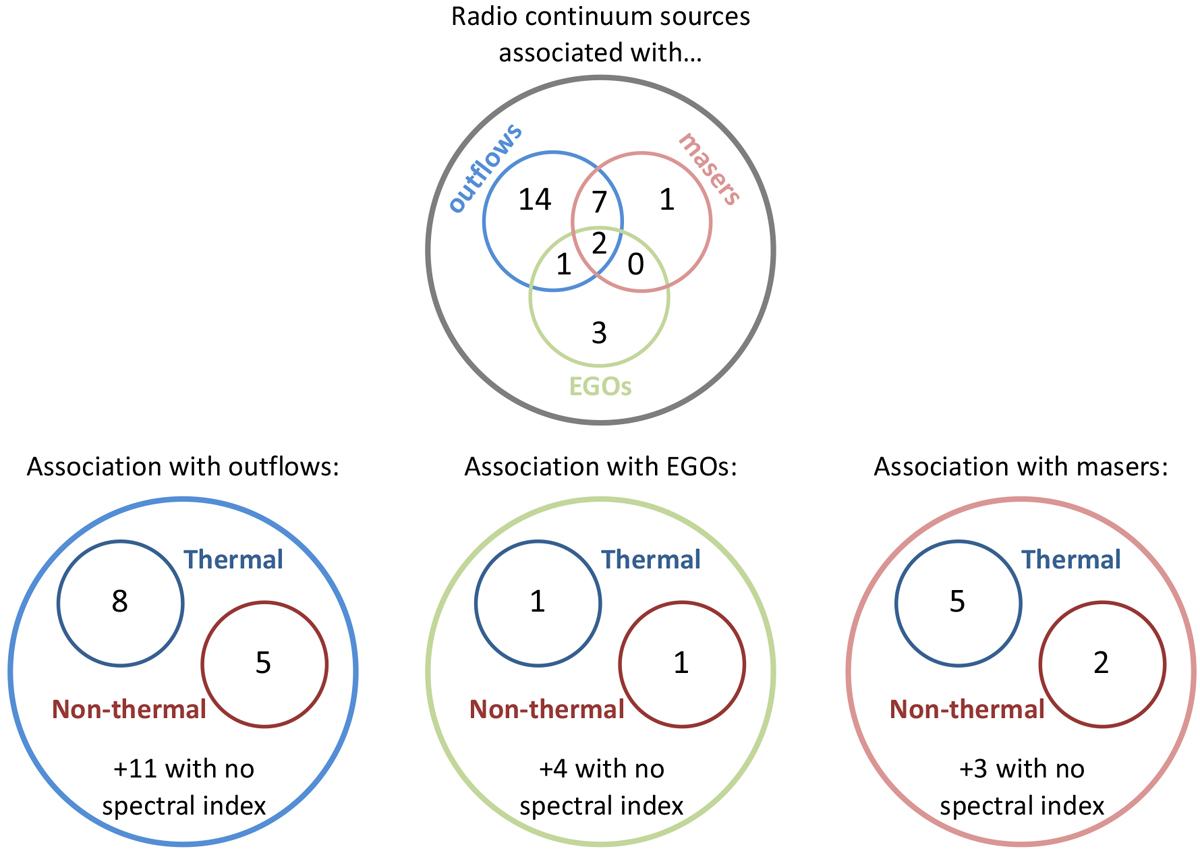
Diagrams summarizing the outflow-activity associations of the radio-jet candidates studied in this work. The integer numbers indicate the number radio-jet candidates in a specific group (see Table 3). Thetop diagram summarizes the association of the radio-jet candidates with molecular outflows, masers, and EGOs (see Sect. 4, for EGOs we only consider an association if the source is labeled “Y” in Table 3). Bottom row diagrams: results regarding the thermal (spectral index > − 0.1) and nonthermal (spectral index <−0.1) properties of the radio continuum emission. The number of sources for which we could not derive the spectral index is also indicated.
Current usage metrics show cumulative count of Article Views (full-text article views including HTML views, PDF and ePub downloads, according to the available data) and Abstracts Views on Vision4Press platform.
Data correspond to usage on the plateform after 2015. The current usage metrics is available 48-96 hours after online publication and is updated daily on week days.
Initial download of the metrics may take a while.