Fig. 3
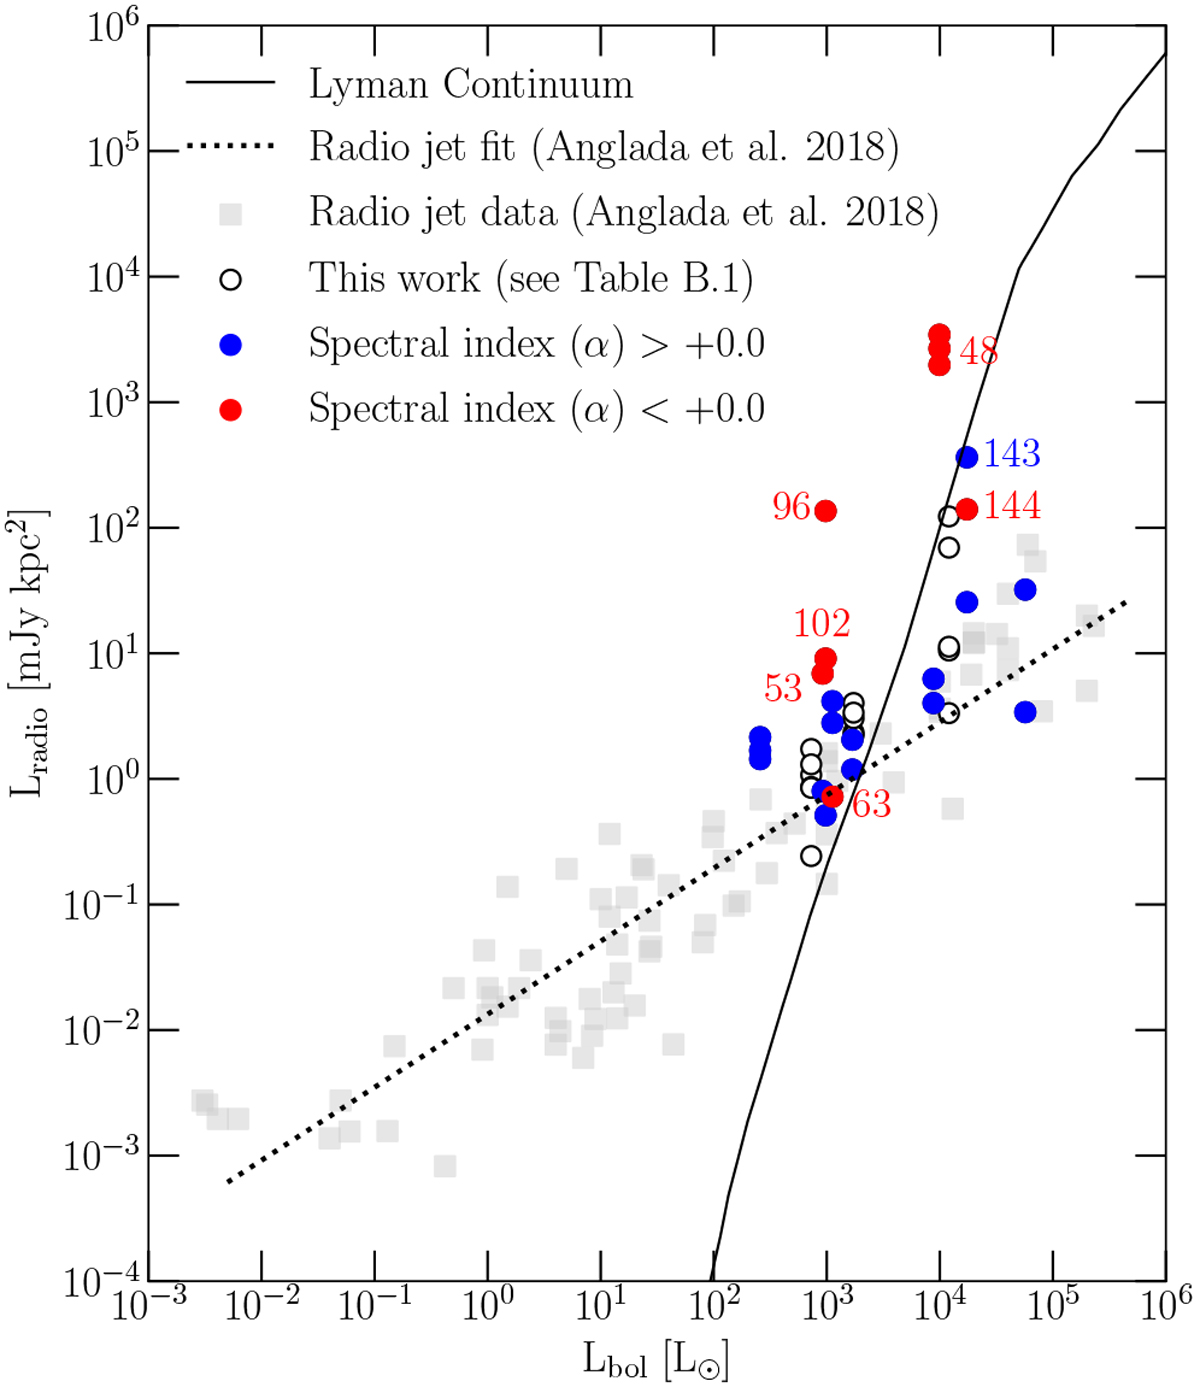
Scatter plot of bolometric luminosity (Lbol) and observed radio continuum luminosity (Lradio) at 6 cm (C band). Open black circles correspond to the continuum sources detected in our work that are located within the primary beam of the K-band (1.3 cm) images (i.e., “iC/iK” in Table B.1). Blue and red symbols mark the sources with positive and negative spectral indices, respectively, as listed in Table B.1 and shown in Fig. 2. The solid line represents the values expected from Lyman continuum radiation for a zero-age main-sequence star of a given luminosity (Thompson 1984). The dashed line is the least-squares fit to the radio jets reported by Anglada et al. (2018, shown as gray squares), corresponding to [Lradio /mJy kpc2] = 10−1.90 [Lbol/L⊙]+0.59 (see their Eq. (28)).
Current usage metrics show cumulative count of Article Views (full-text article views including HTML views, PDF and ePub downloads, according to the available data) and Abstracts Views on Vision4Press platform.
Data correspond to usage on the plateform after 2015. The current usage metrics is available 48-96 hours after online publication and is updated daily on week days.
Initial download of the metrics may take a while.