Fig. 2
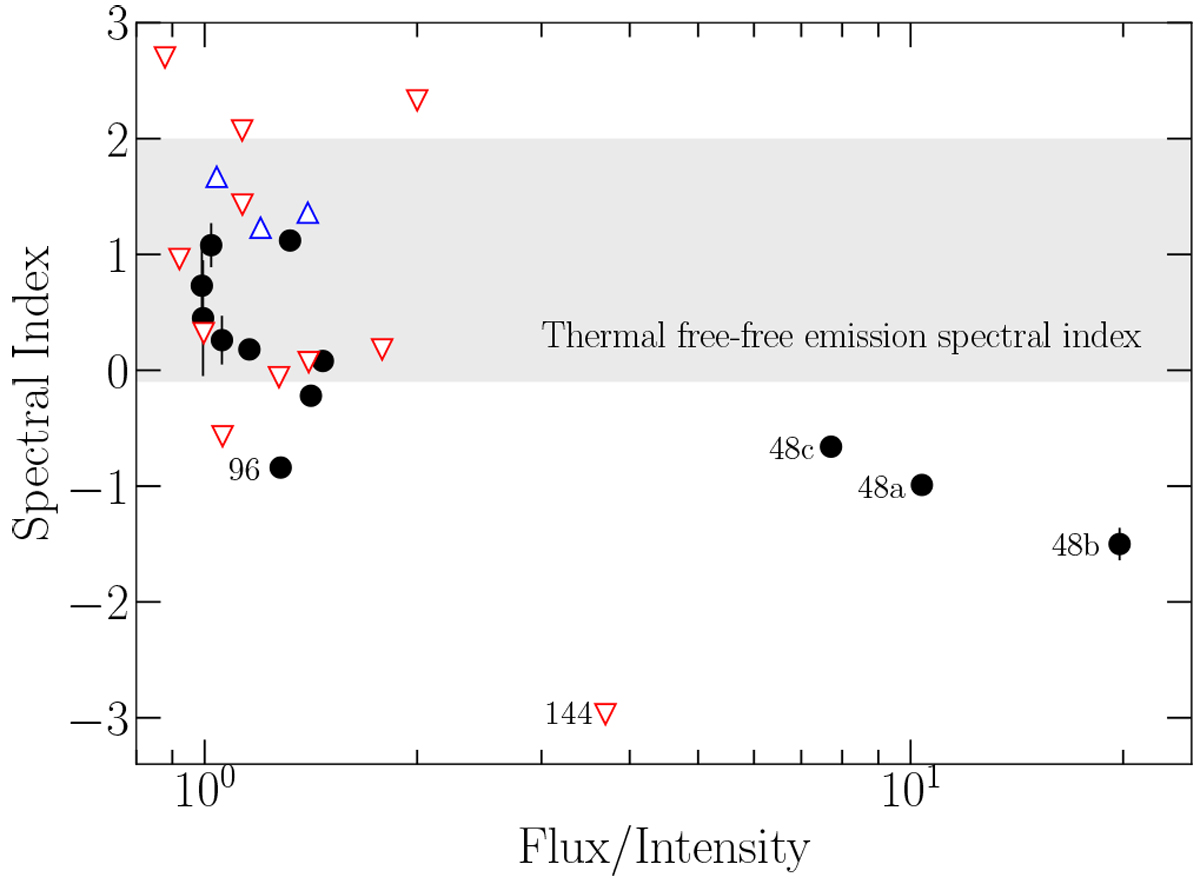
Spectral index (α, see Sect. 3.2) against the flux-to-intensity ratio for the radio continuum sources detected in both frequency bands and inside the primary beam of both images (sources listed as “iC/iK” in Table B.1). The gray shaded region depicts the spectral index regime associated with thermal free–free emission (i.e., in the range from − 0.1 to + 2). Black dots correspond to sources detected in both bands (see spectral indices in Table 3), blue upward-pointing triangles correspond to sources detected only in the K band (i.e., lower limits), and red downward-pointing triangles correspond to sources detected only in the C band (i.e., upper limits).
Current usage metrics show cumulative count of Article Views (full-text article views including HTML views, PDF and ePub downloads, according to the available data) and Abstracts Views on Vision4Press platform.
Data correspond to usage on the plateform after 2015. The current usage metrics is available 48-96 hours after online publication and is updated daily on week days.
Initial download of the metrics may take a while.