Fig. A.13
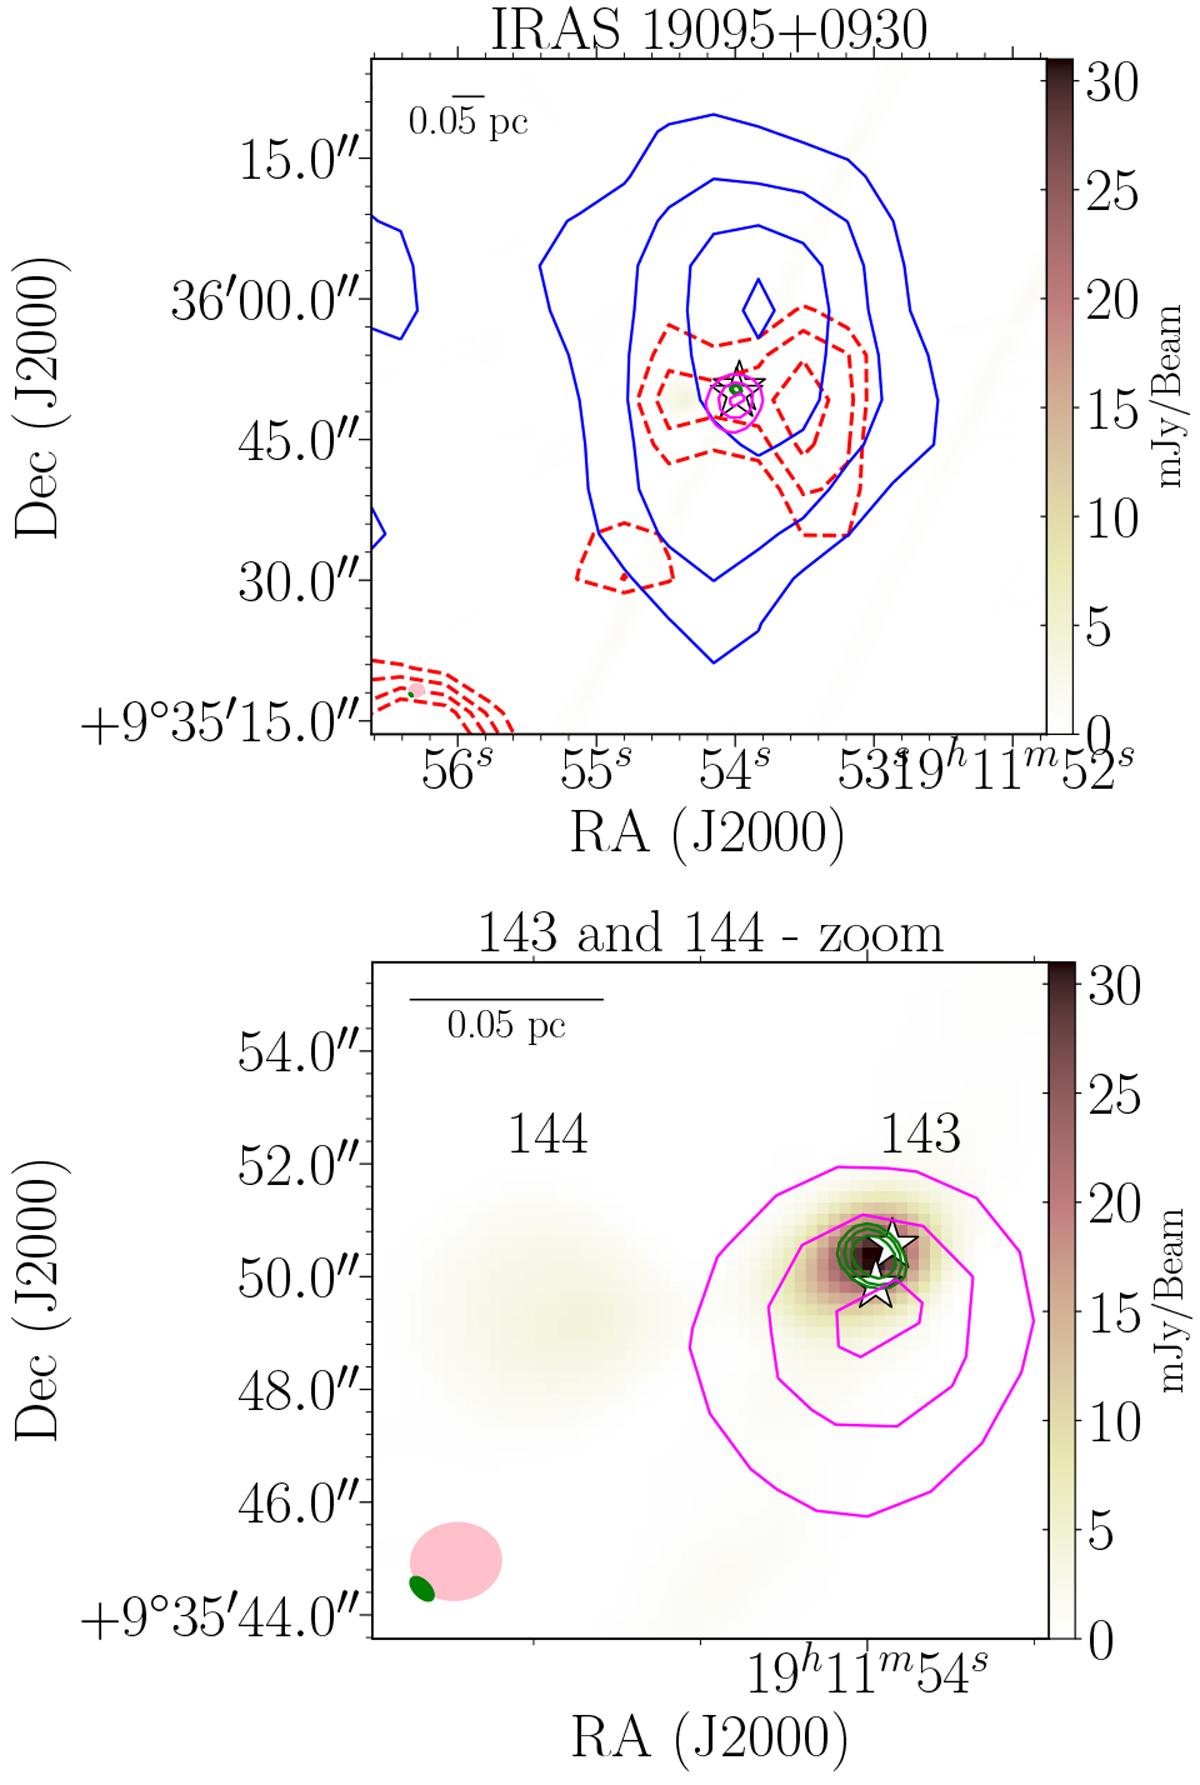
VLA C-band (6 cm) continuum emission map of radio sources 143 and 144 located in the region IRAS 19095+0930. A close-up view of the radio sources (143 and 144) is shown in the bottom panel. The green contour levels of the K-band (1.3 cm) continuum emission are 3, 5, and 9 times 2 mJy beam−1. The blue- and redshifted outflow lobes of SiO (2−1) are shown assolid blue and dashed red contours, respectively (see Sánchez-Monge et al. 2013b). The magenta contours show the Spitzer/GLIMPSE 4.5 μm emission. The pink and green ellipses are the beam sizes of the C and K bands, respectively. The white and orange stars mark the of the H2O and CH3OH masers (see Table 2).
Current usage metrics show cumulative count of Article Views (full-text article views including HTML views, PDF and ePub downloads, according to the available data) and Abstracts Views on Vision4Press platform.
Data correspond to usage on the plateform after 2015. The current usage metrics is available 48-96 hours after online publication and is updated daily on week days.
Initial download of the metrics may take a while.