Fig. A.10
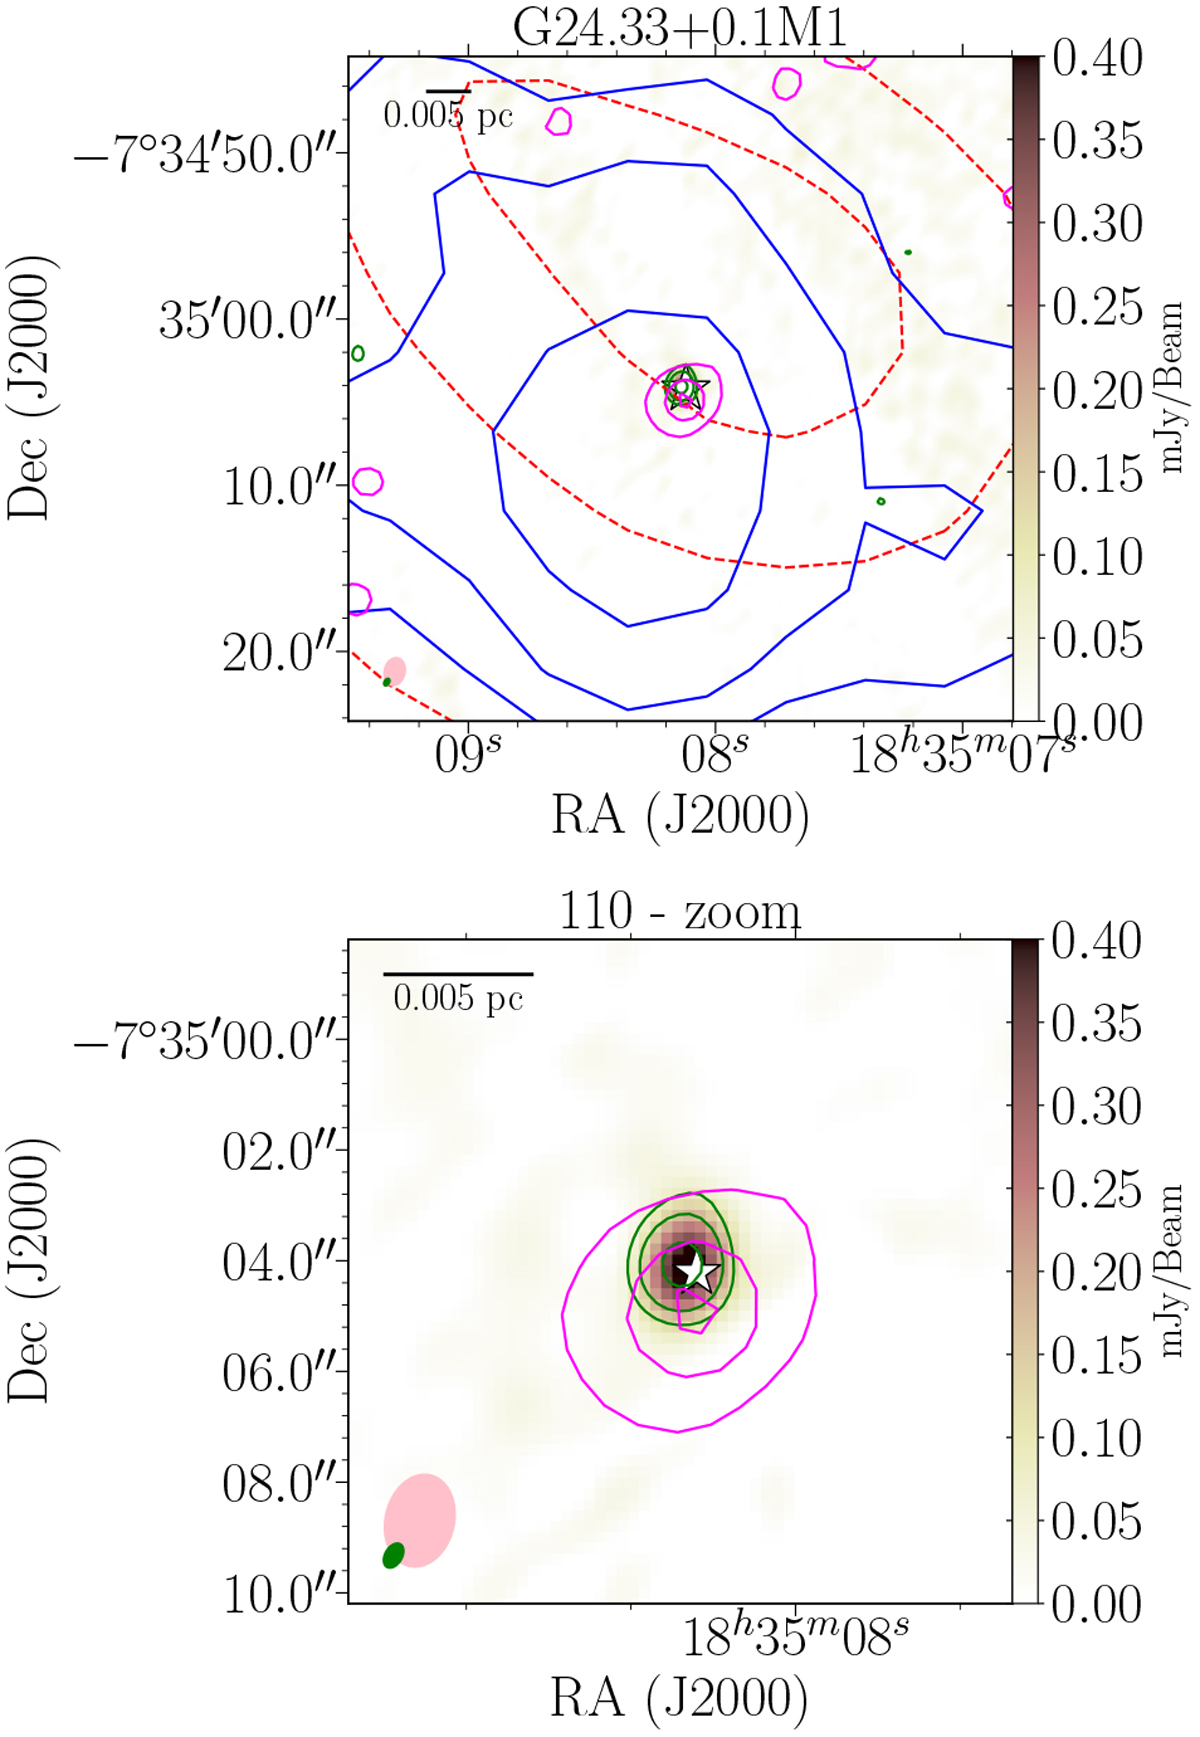
VLA C-band (6 cm) continuum emission map of radio-jet candidate 110 located in the region G24.33+0.1 M1. A close-up view of the radio source is shown in the bottom panel. The green contour levels of the K-band (1.3 cm) continuum emission are 3, 5, and 9 times 7 μJy beam−1. The blue- and redshifted outflow lobes of SiO (2−1) are shown as solid blue and dashed red contours, respectively (see Sánchez-Monge et al. 2013b). The pink and green ellipses are the beam sizes of the C and K bands, respectively. The white star marks the location of the H2O (see Table 2).
Current usage metrics show cumulative count of Article Views (full-text article views including HTML views, PDF and ePub downloads, according to the available data) and Abstracts Views on Vision4Press platform.
Data correspond to usage on the plateform after 2015. The current usage metrics is available 48-96 hours after online publication and is updated daily on week days.
Initial download of the metrics may take a while.