Fig. A.8
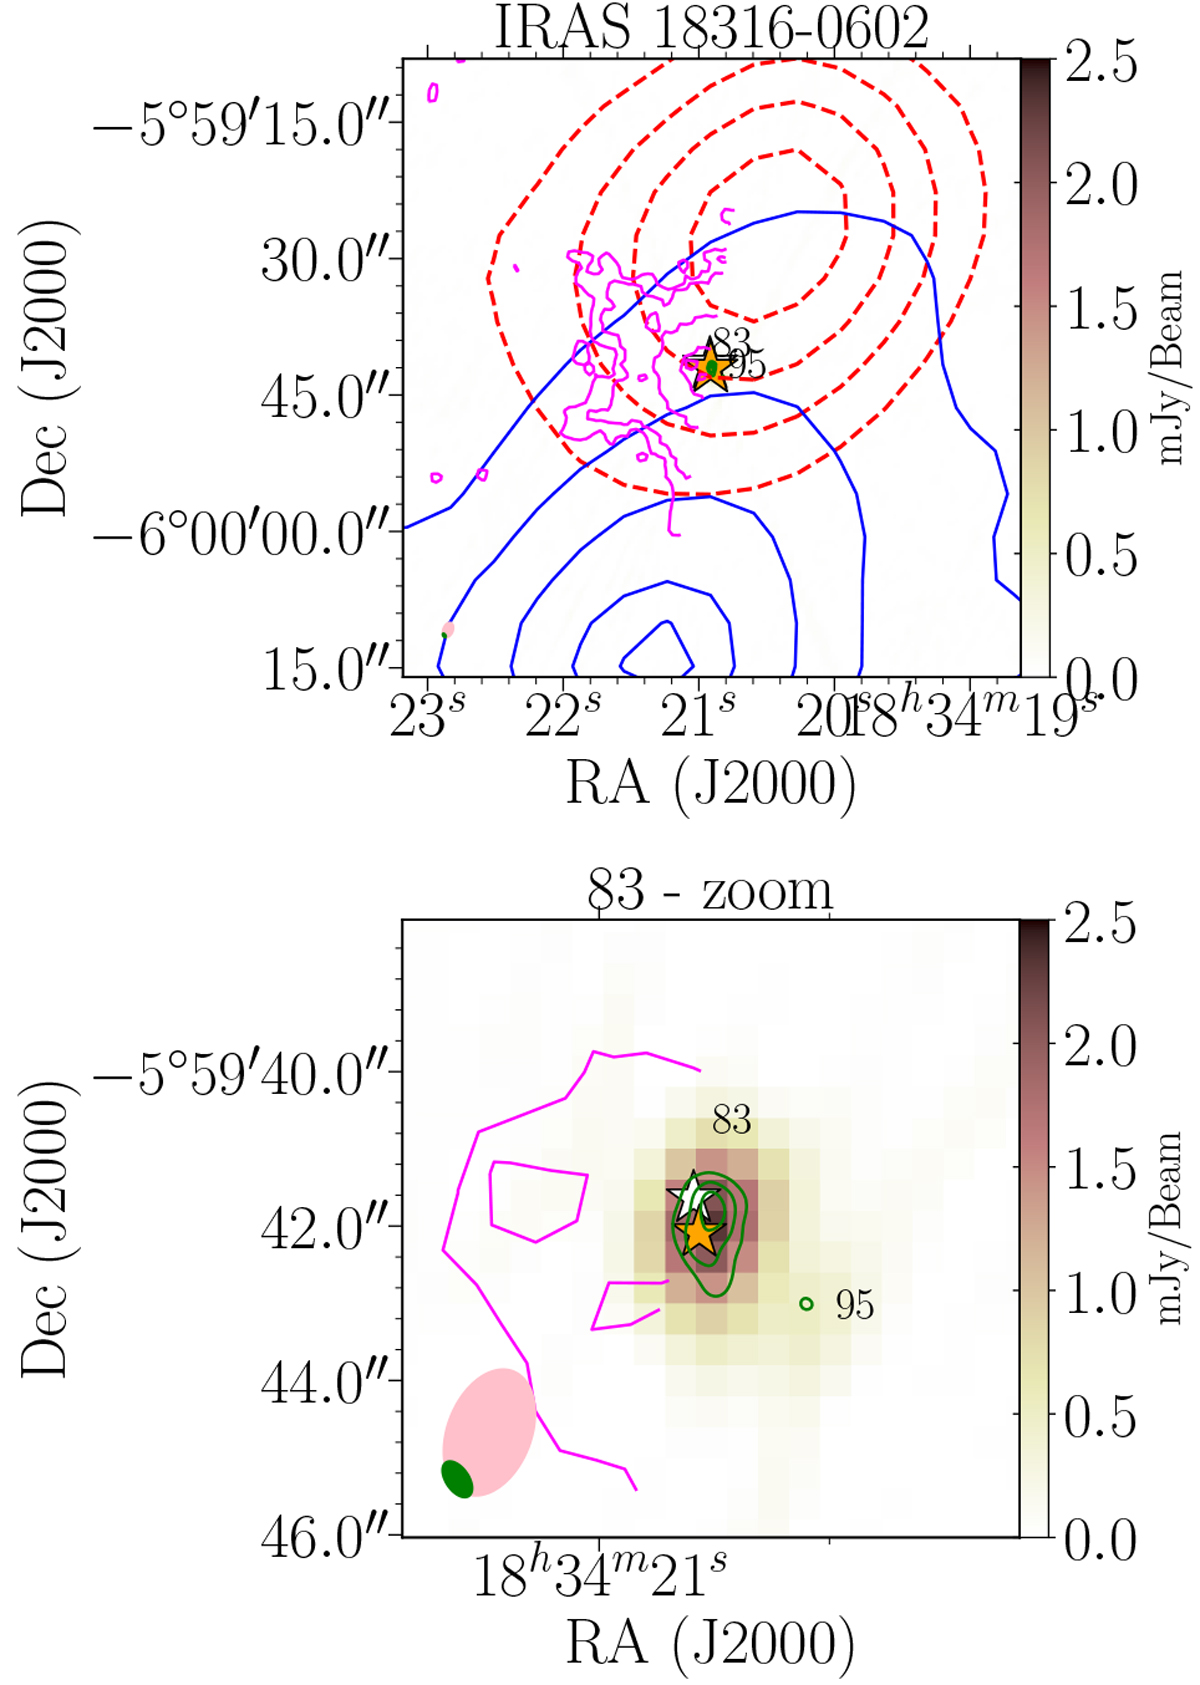
VLA C-band (6 cm) continuum emission map of radio jet candidates 83 and 95 located in the region IRAS 18316−1602. A close-upview of the two radio sources is shown in the bottom panel. The green contour levels of the K-band (1.3 cm) continuum emission are 3, 5, 9, and 11 times 27 μJy beam−1. The magenta contours show the Spitzer/GLIMPSE 4.5 μm emission (note that half of the region was not covered in the mapped area). The blue- and redshifted outflow lobes of SiO (2−1) are shown as solid blue and dashed red contours, respectively (see Sánchez-Monge et al. 2013b). The pink and green ellipses are the beam sizes of the C and K bands, respectively. The white and orange stars mark the location of the H2O and CH3OH masers, respectively (see Table 2).
Current usage metrics show cumulative count of Article Views (full-text article views including HTML views, PDF and ePub downloads, according to the available data) and Abstracts Views on Vision4Press platform.
Data correspond to usage on the plateform after 2015. The current usage metrics is available 48-96 hours after online publication and is updated daily on week days.
Initial download of the metrics may take a while.