Fig. 1
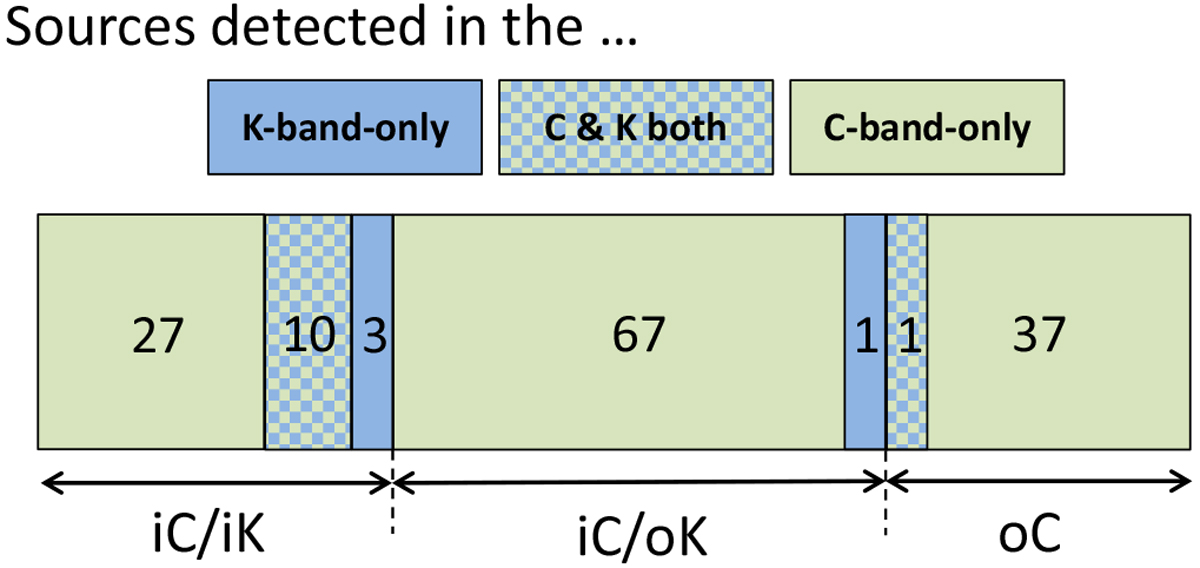
Number of radio continuum sources detected in the K-band images (marked in blue and corresponding to 15 sources) and in the C-band images (marked in green and corresponding to 142 sources). Only 4 of the 146 detections are detected in the K-band images alone. The vast majority (131) are detected only in the C-band images (see Sect. 3.1 for more details). The bottom labels mark the sources that are located within the primary beams of the K-band and C-band images. Thirty-eight sources are located outside the C-band primary beam (oC), 68 sources are located inside the C-band primary beam but outside the K-band primary beam (iC/oK), and 40 sources are located within the primary beam of both images (iC/iK). See Sects. 3.1 and 3.2 for more details.
Current usage metrics show cumulative count of Article Views (full-text article views including HTML views, PDF and ePub downloads, according to the available data) and Abstracts Views on Vision4Press platform.
Data correspond to usage on the plateform after 2015. The current usage metrics is available 48-96 hours after online publication and is updated daily on week days.
Initial download of the metrics may take a while.