Fig. 5.
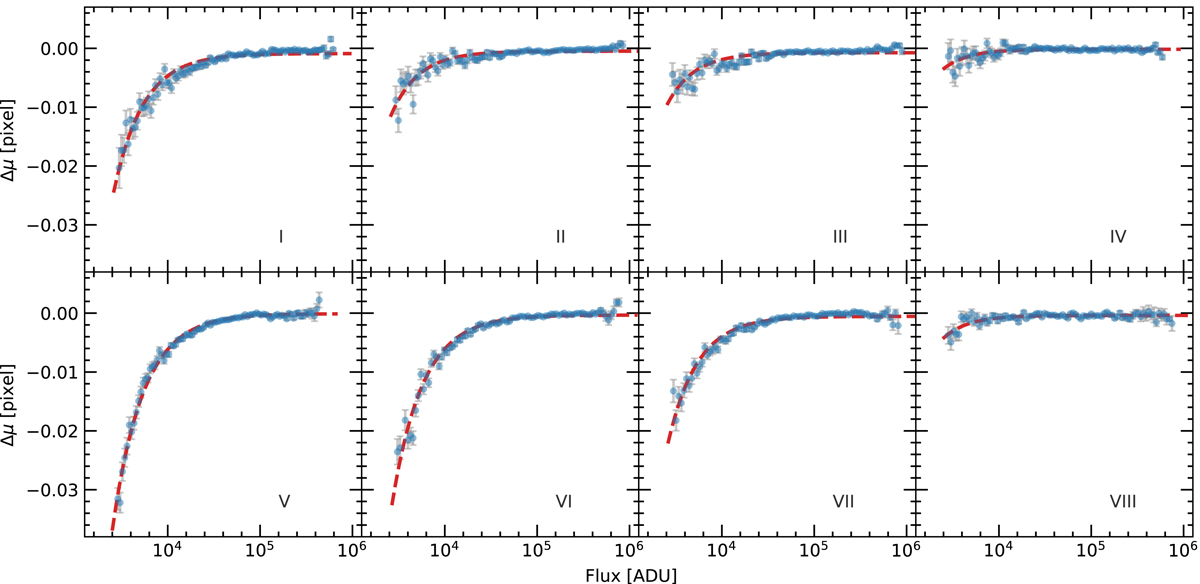
Correlation between line centroid and integrated line signal intensities (in log scale) in different areas of the CCDs. Each CCD was divided into four stripes that are parallel to the cross-dispersion direction, and each stripe covers an interval of 1024 pixels along the main dispersion direction. All LFC lines from the 160 spectra were used to produce this plot. Lines are grouped into 100 flux bins in each subplot (stripe). Exponential functions are used to fit the line shifts as a function of the measured line flux. The fit result is shown with the dashed red line. The relative drift Δμ is measured in pixel space, compared with the reference acquisition, i.e. the acquisition with the highest averaged counts (or lowest attenuation).
Current usage metrics show cumulative count of Article Views (full-text article views including HTML views, PDF and ePub downloads, according to the available data) and Abstracts Views on Vision4Press platform.
Data correspond to usage on the plateform after 2015. The current usage metrics is available 48-96 hours after online publication and is updated daily on week days.
Initial download of the metrics may take a while.