Free Access
Fig. 4.
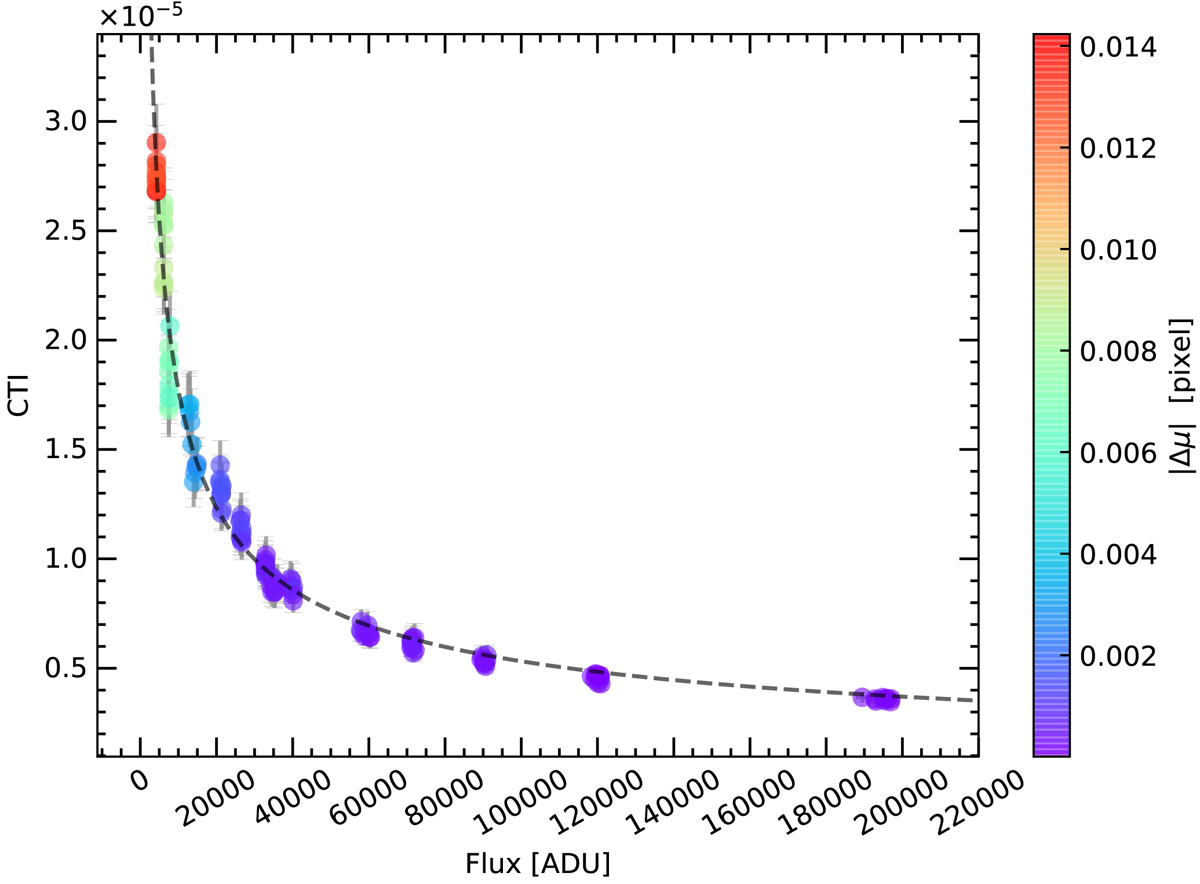
Correlation between the CTI indicator and the integrated line flux. The shift Δμ of the line’s centre of gravity in reference to the first spectrum of series 01 (see Table 1) is shown via the colour scale.
Current usage metrics show cumulative count of Article Views (full-text article views including HTML views, PDF and ePub downloads, according to the available data) and Abstracts Views on Vision4Press platform.
Data correspond to usage on the plateform after 2015. The current usage metrics is available 48-96 hours after online publication and is updated daily on week days.
Initial download of the metrics may take a while.