Fig. 3.
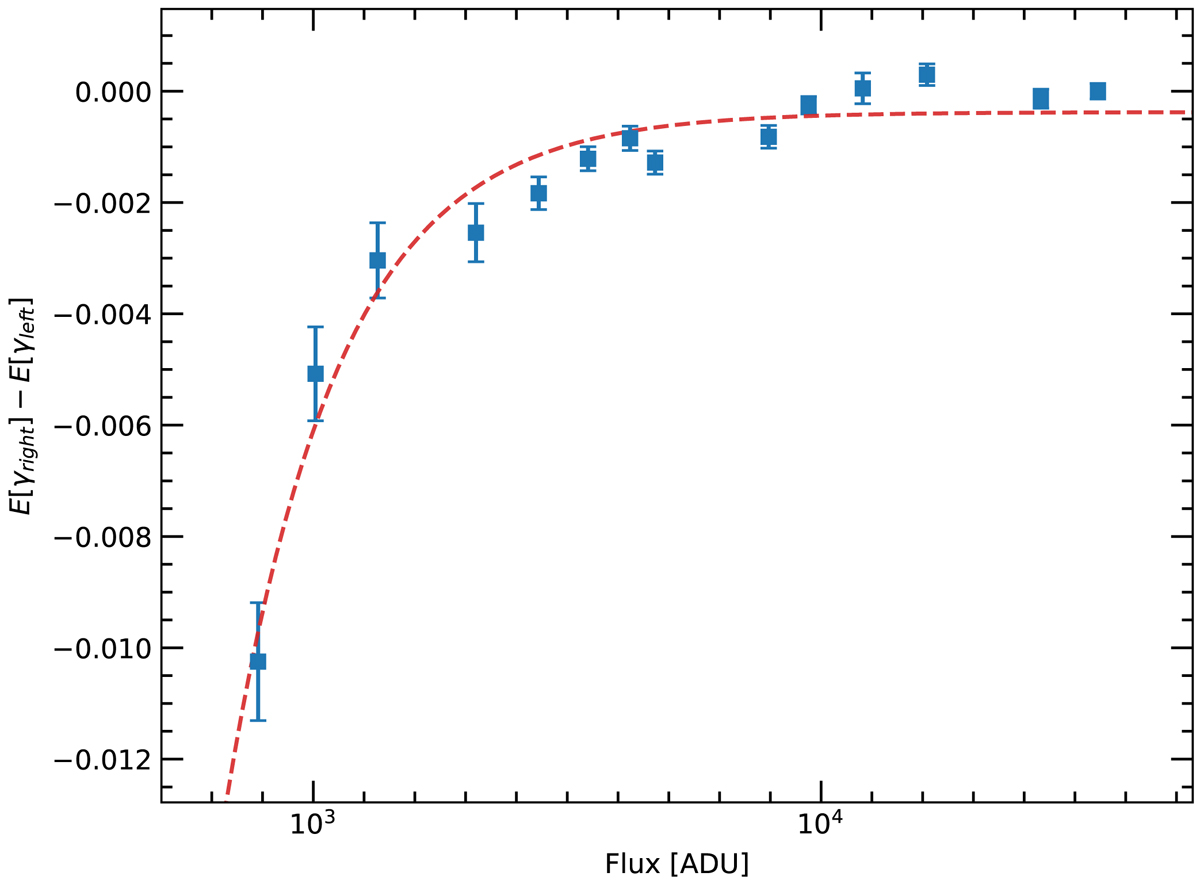
Differential variation (the closer to the right the points are, the closer they are to the serial register) of the normalized third moment, γ, as a function of flux (averaged peak flux of the comb lines in log scale). The range of the left part of the detector goes from the first to the 2048th pixel along the dispersion direction on detectors. The right part of the detector goes from 2048th to the 4096th pixel. Operator E stands for the averaged value for each side on the chip. The dashed red line is an exponential fit to the data points.
Current usage metrics show cumulative count of Article Views (full-text article views including HTML views, PDF and ePub downloads, according to the available data) and Abstracts Views on Vision4Press platform.
Data correspond to usage on the plateform after 2015. The current usage metrics is available 48-96 hours after online publication and is updated daily on week days.
Initial download of the metrics may take a while.