Fig. 1.
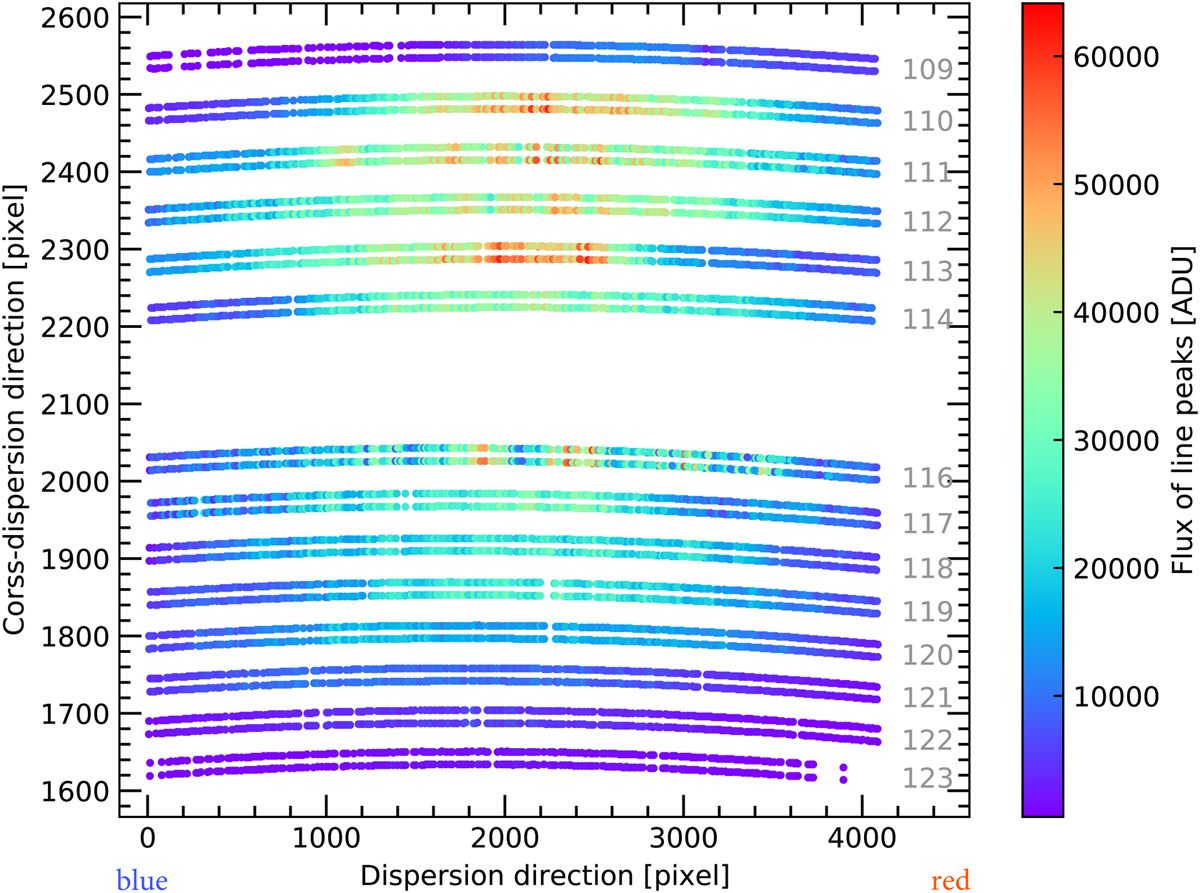
Visualization of the LFC raw spectrum on the CCDs. The peak intensity of the detected LFC lines is displayed via the colour code. Each echelle order’s number is marked on the right end of each order curve. The two 2k × 4k CCDs are matched together at the gap between order 114 and 116. The serial register in this figure is to the right, at redder wavelengths.
Current usage metrics show cumulative count of Article Views (full-text article views including HTML views, PDF and ePub downloads, according to the available data) and Abstracts Views on Vision4Press platform.
Data correspond to usage on the plateform after 2015. The current usage metrics is available 48-96 hours after online publication and is updated daily on week days.
Initial download of the metrics may take a while.