Fig. J.1
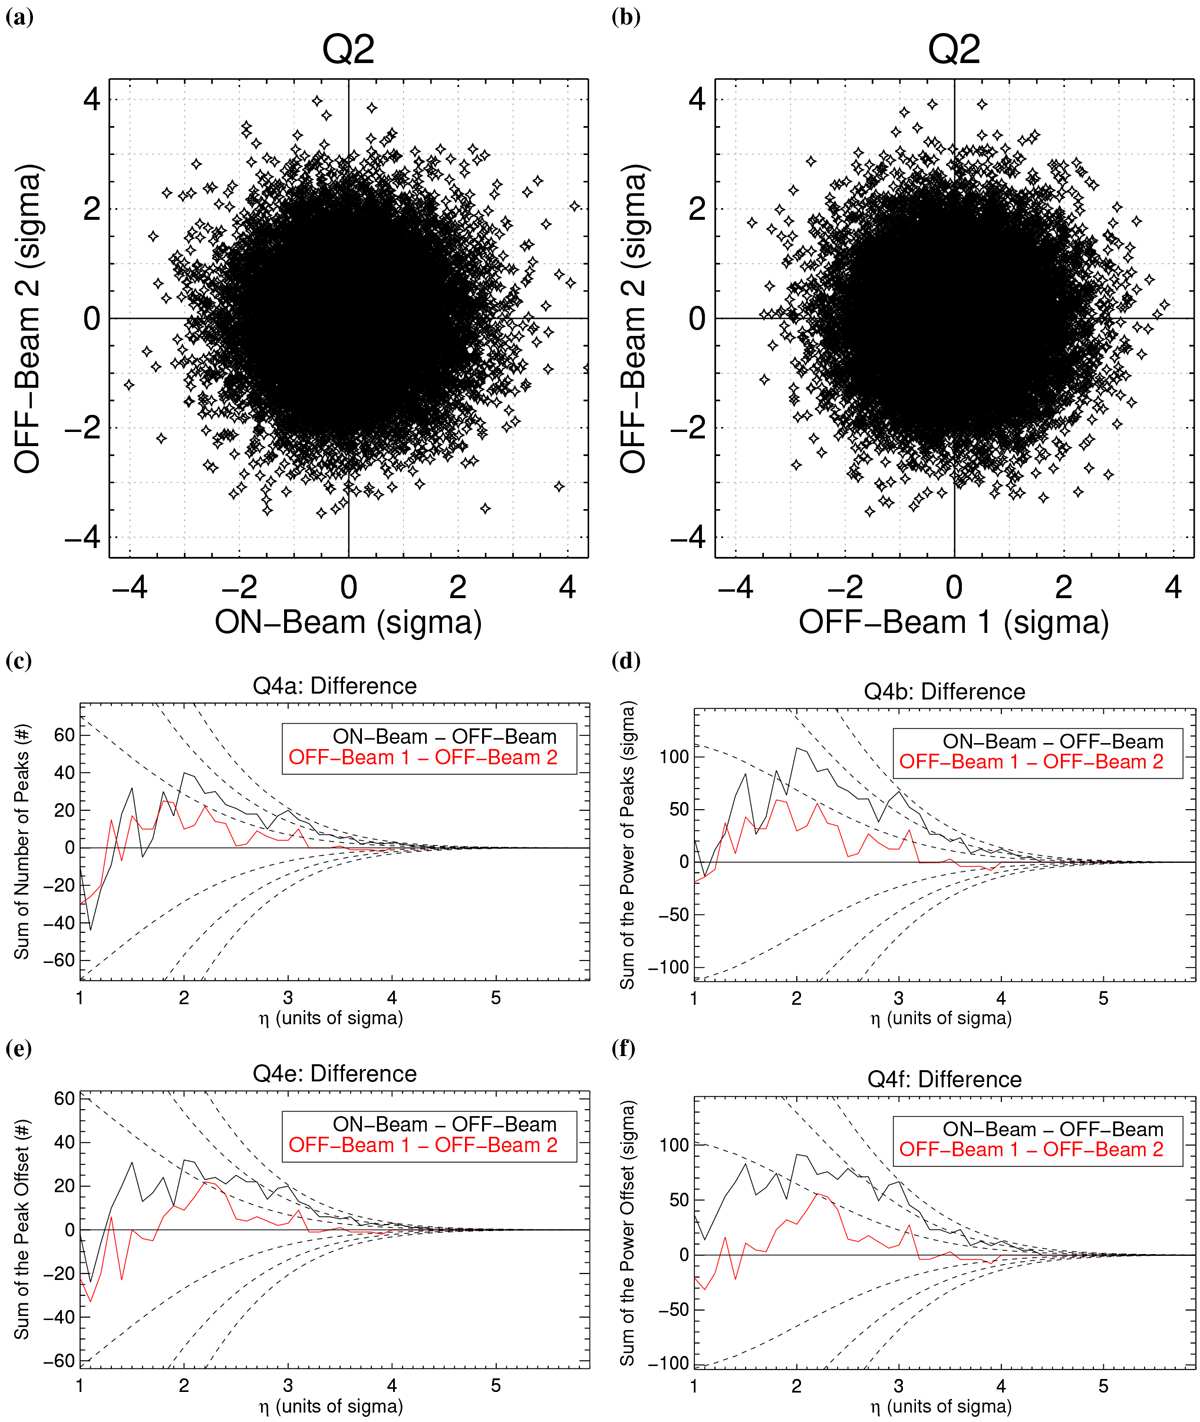
Q2 (panels a and b) and beam differences for Q4a (panel c), Q4b (panel d), Q4e (panel e), and Q4f (panel f) for υ And in observation L545197 in the range 14–38 MHz in Stokes-V (![]() ). The tentative signal is most clearly seen in Q4f, which is distinctly different for the ON-beam (black curve) than for the OFF beams (red curve). The other comments are the same as Fig. 4. The probability to reproduce the ON-beam curve by chance is 1.3% or 2.2σ, whereas the false-positive probability for the OFF beams is 59%. Additionally, we performed the Kolmogorov–Smirnov statistical test on the two curves for Q4f in panel f and find that the probability to reject the null hypothesis (that the two curves are drawn from the same parent distribution) is 76%. Therefore, the signal is possibly a false-positive.
). The tentative signal is most clearly seen in Q4f, which is distinctly different for the ON-beam (black curve) than for the OFF beams (red curve). The other comments are the same as Fig. 4. The probability to reproduce the ON-beam curve by chance is 1.3% or 2.2σ, whereas the false-positive probability for the OFF beams is 59%. Additionally, we performed the Kolmogorov–Smirnov statistical test on the two curves for Q4f in panel f and find that the probability to reject the null hypothesis (that the two curves are drawn from the same parent distribution) is 76%. Therefore, the signal is possibly a false-positive.
Current usage metrics show cumulative count of Article Views (full-text article views including HTML views, PDF and ePub downloads, according to the available data) and Abstracts Views on Vision4Press platform.
Data correspond to usage on the plateform after 2015. The current usage metrics is available 48-96 hours after online publication and is updated daily on week days.
Initial download of the metrics may take a while.