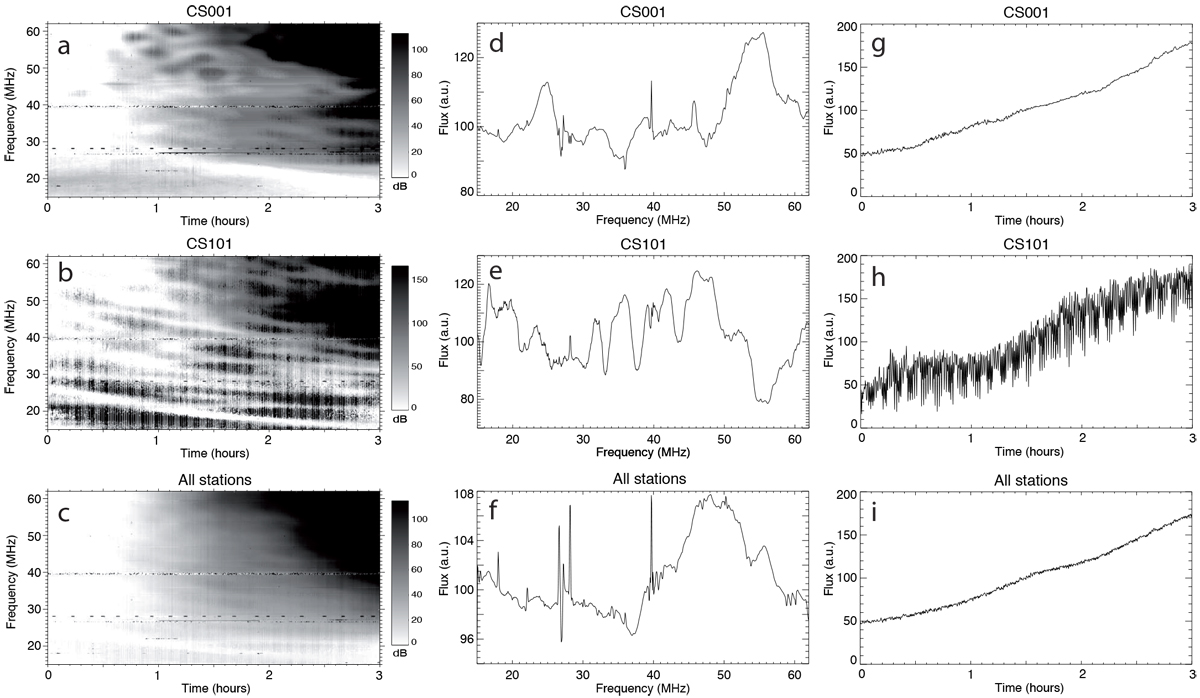
Fig. H.1

Analysis of the station inspection plots for observation L570725. Top row: good station CS001 (panels a, d, g). Middle row:bad station CS101 (panels b, e, h). Bottom row: incoherent (not phased) sum of all stations. Left column (panels a–c): station inspection plots. Each plot has been normalized by an average background. Large scale features are seen foe the bad station CS101. Middle column (panels d–f): integrated spectra (Q1b) derived from the station inspection plots. Right column (panels g–i): time-series (Q1a) derived from the station inspection plots. No large bumps are seen within 20–30 MHz for the bad station (CS101), therefore they do not seem to be cause of the L570725 ON-beam signal seen in Fig. 5.
Current usage metrics show cumulative count of Article Views (full-text article views including HTML views, PDF and ePub downloads, according to the available data) and Abstracts Views on Vision4Press platform.
Data correspond to usage on the plateform after 2015. The current usage metrics is available 48-96 hours after online publication and is updated daily on week days.
Initial download of the metrics may take a while.


