Fig. D.1
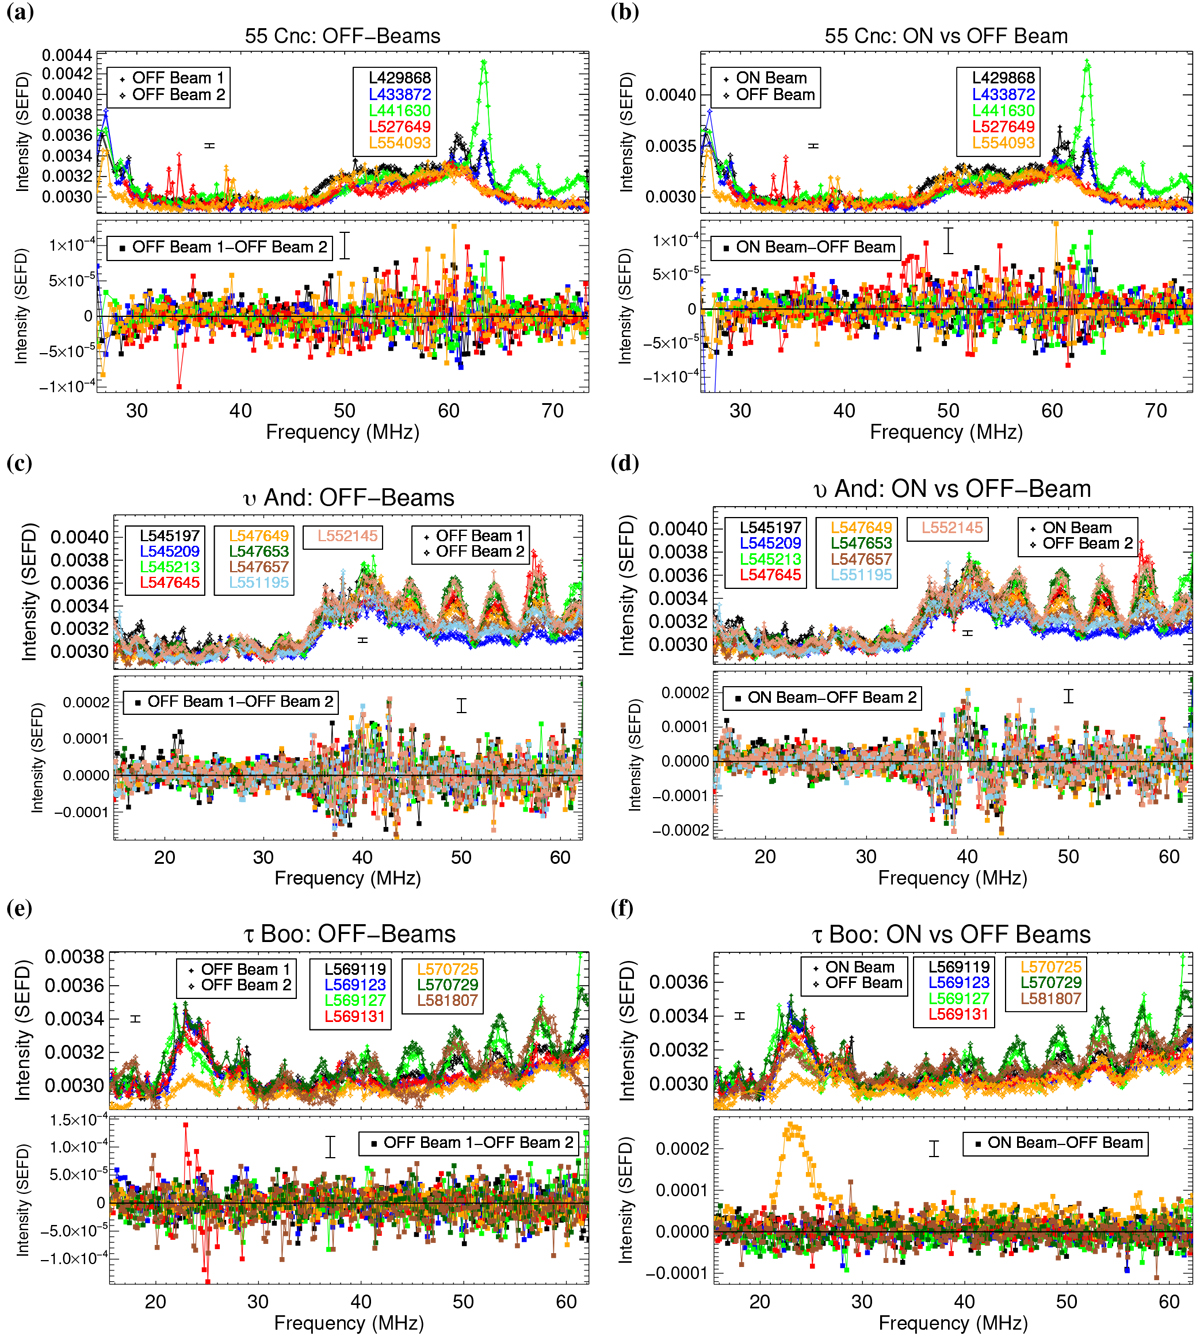
Integrated spectrum (Q1b) for all beams in all observations for 55 Cnc (panels a and b), υ And (panels c and d), and τ Boo (panels e and f). Large scale features are seen for all dates, however, they change between observations. Panels c–f: ripple pattern that is likely due to an instrumental effect (e.g., imperfect phasing). There are no large-scale differences seen between thetwo OFF beams (bottom plots in panels a, c, and e) for any date. In every individual observation, the two OFF-beams and ON-beam (expect L570725) are equivalent with each other within the pure Gaussian noise error bars (![]() ). Dynamic spectrum differences of all OFF beams in every τ Boo observation can be found in Fig. I.1. The τ Boo ON-beam signal in observation L570725 (orange curve in panel f) is the only large-scale difference between the ON and OFF beams that is seen (bottom plot in all panels). The 20–30 MHz features in many of the τ Boo b dates are the same order of magnitude as the ON-beam signal in observation L570725 (panel e). The dynamic spectrum of the ON-beam in observation L570725 subtracted by the OFF beams in the other τ Boo observationscan be found in Fig. I.1.
). Dynamic spectrum differences of all OFF beams in every τ Boo observation can be found in Fig. I.1. The τ Boo ON-beam signal in observation L570725 (orange curve in panel f) is the only large-scale difference between the ON and OFF beams that is seen (bottom plot in all panels). The 20–30 MHz features in many of the τ Boo b dates are the same order of magnitude as the ON-beam signal in observation L570725 (panel e). The dynamic spectrum of the ON-beam in observation L570725 subtracted by the OFF beams in the other τ Boo observationscan be found in Fig. I.1.
Current usage metrics show cumulative count of Article Views (full-text article views including HTML views, PDF and ePub downloads, according to the available data) and Abstracts Views on Vision4Press platform.
Data correspond to usage on the plateform after 2015. The current usage metrics is available 48-96 hours after online publication and is updated daily on week days.
Initial download of the metrics may take a while.