Fig. C.3
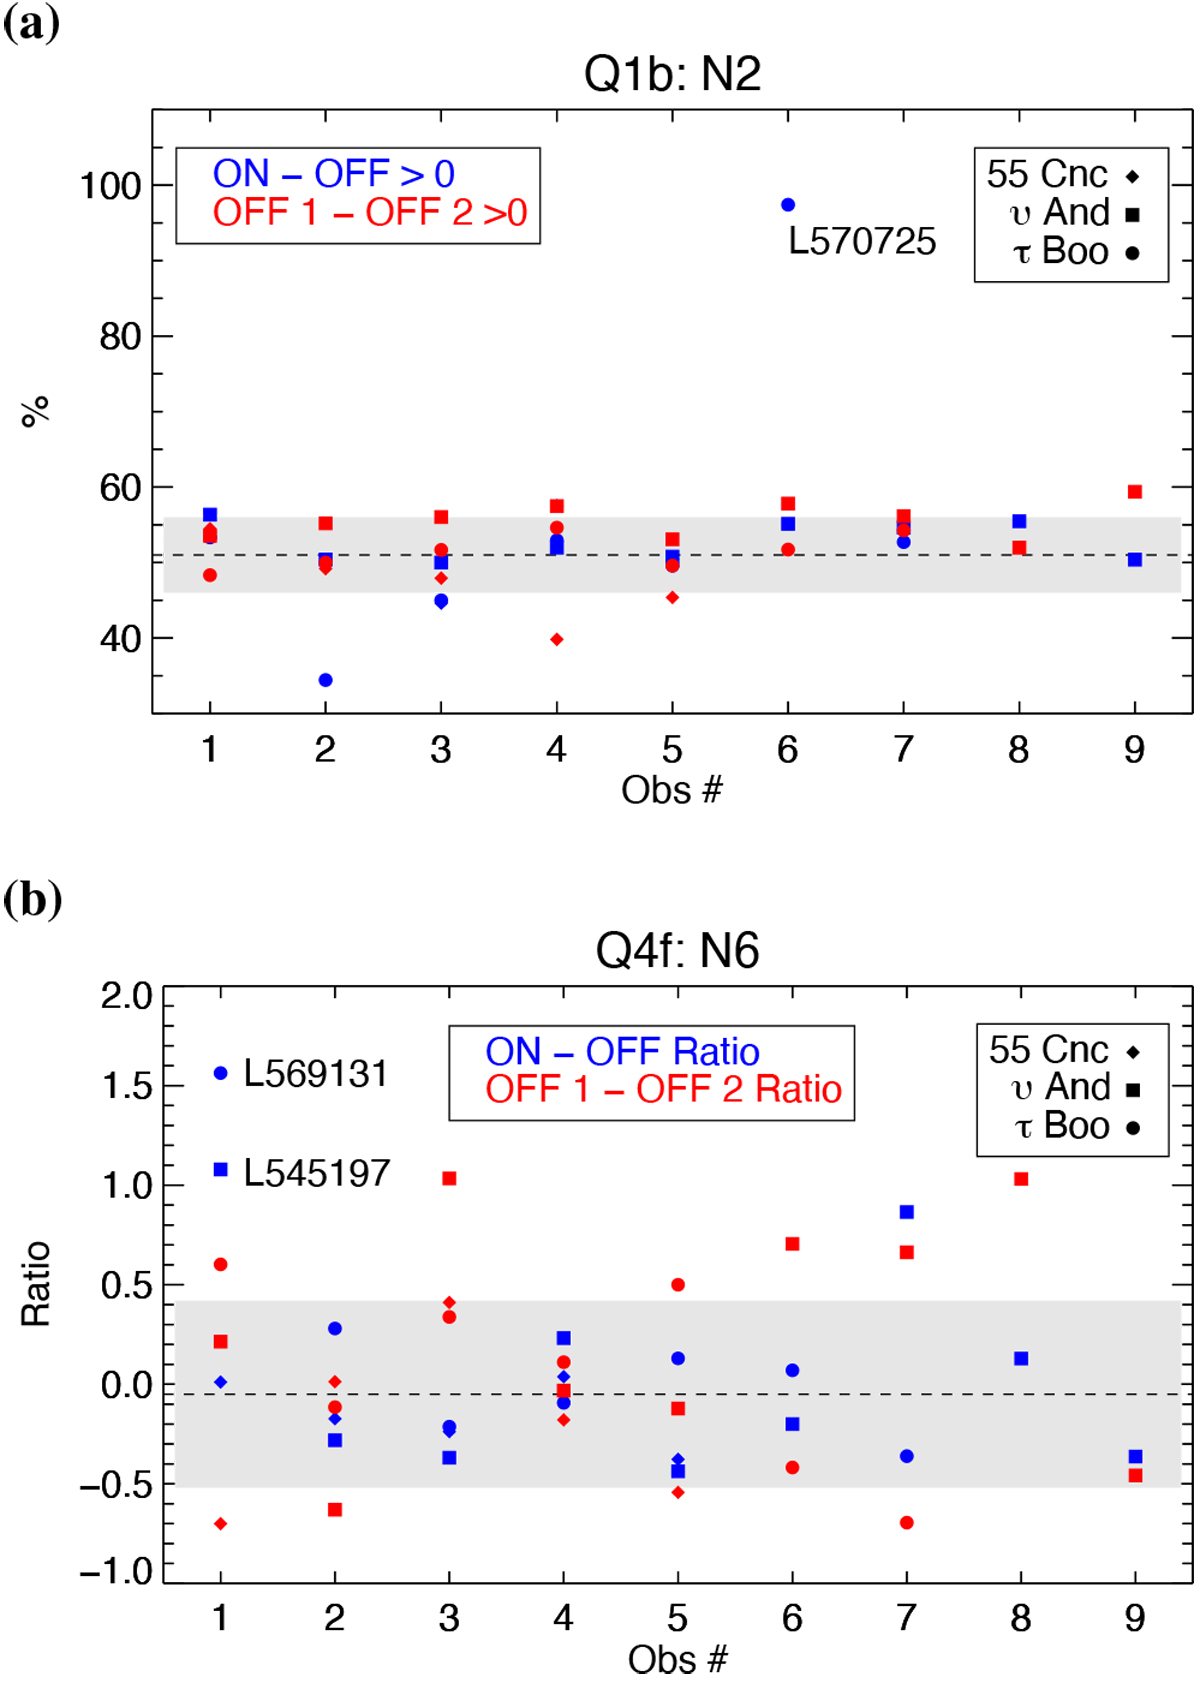
Detection criteria for all observations. Panel a: detection criterion N2 for the observable quantity Q1b. Panel b: detection criterion N6 for the observable quantity Q4f. Only the lowest frequency band (15–38 MHz for τ Boo and υ And and 26–50 MHz for 55 Cnc) and |V| is shown. The median value for all post-processing runs is shown as a dashed line. The 1 σ standard deviation is shown as the gray area.
Current usage metrics show cumulative count of Article Views (full-text article views including HTML views, PDF and ePub downloads, according to the available data) and Abstracts Views on Vision4Press platform.
Data correspond to usage on the plateform after 2015. The current usage metrics is available 48-96 hours after online publication and is updated daily on week days.
Initial download of the metrics may take a while.