Fig. 9
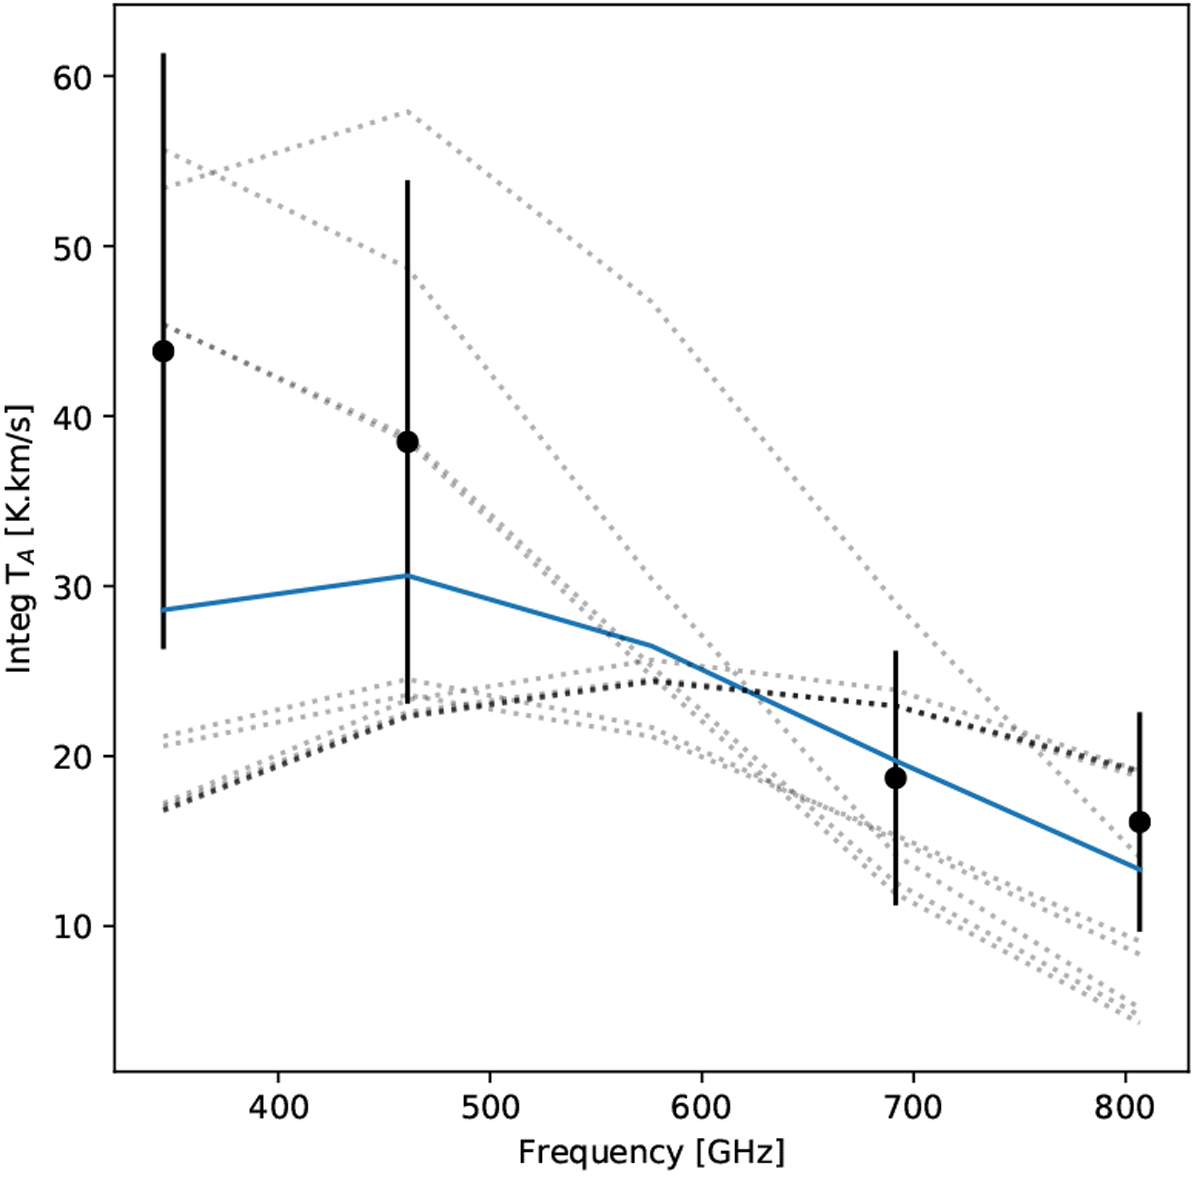
Example spectral line energy distribution used for fitting the temperature toward the blue lobe of outflow A. The data (black circles with errorbars) are at CO transitions (3–2), (4–3), (6–5), and (7–6). The model fits (dotted and solid line) from RADEX also include CO (5–4). The dotted line represents the best fit (χ2 = 1 ± 0.05) SLEDs fromthe RADEX grid. The solid line represents the average value for these best fit models in (for this example) SLED. This fit gives Tkin = 66 K.
Current usage metrics show cumulative count of Article Views (full-text article views including HTML views, PDF and ePub downloads, according to the available data) and Abstracts Views on Vision4Press platform.
Data correspond to usage on the plateform after 2015. The current usage metrics is available 48-96 hours after online publication and is updated daily on week days.
Initial download of the metrics may take a while.