Fig. 3
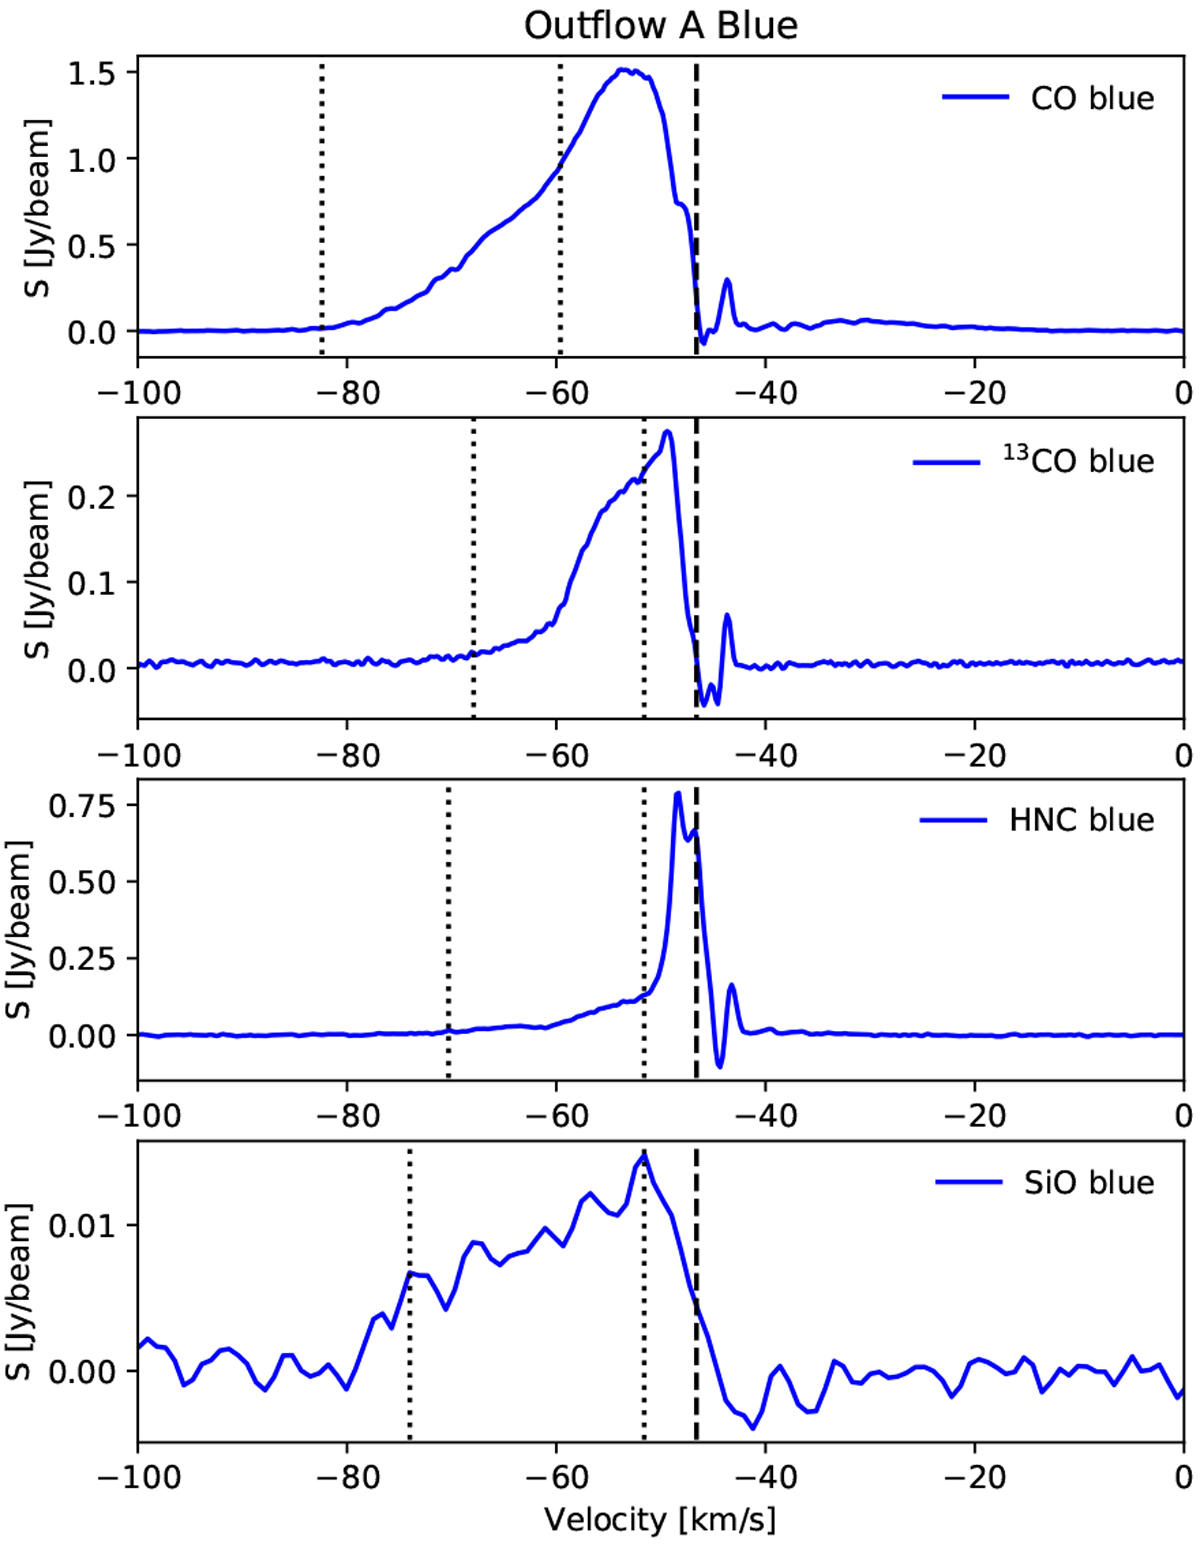
Averaged spectra measured toward the blue lobe of outflow A for species CO, 13CO, HNC and SiO. The spectra are measured within the outer contour of the integrated intensity maps from Fig. 2 for each species. The vertical dashed line gives the Vlsr of the target and the vertical dotted lines mark the range in velocity from Table 2, based on which the integrated intensity maps were produced as were the CO outflow property calculations. The chosen limits are described in the main text.
Current usage metrics show cumulative count of Article Views (full-text article views including HTML views, PDF and ePub downloads, according to the available data) and Abstracts Views on Vision4Press platform.
Data correspond to usage on the plateform after 2015. The current usage metrics is available 48-96 hours after online publication and is updated daily on week days.
Initial download of the metrics may take a while.