Fig. 2
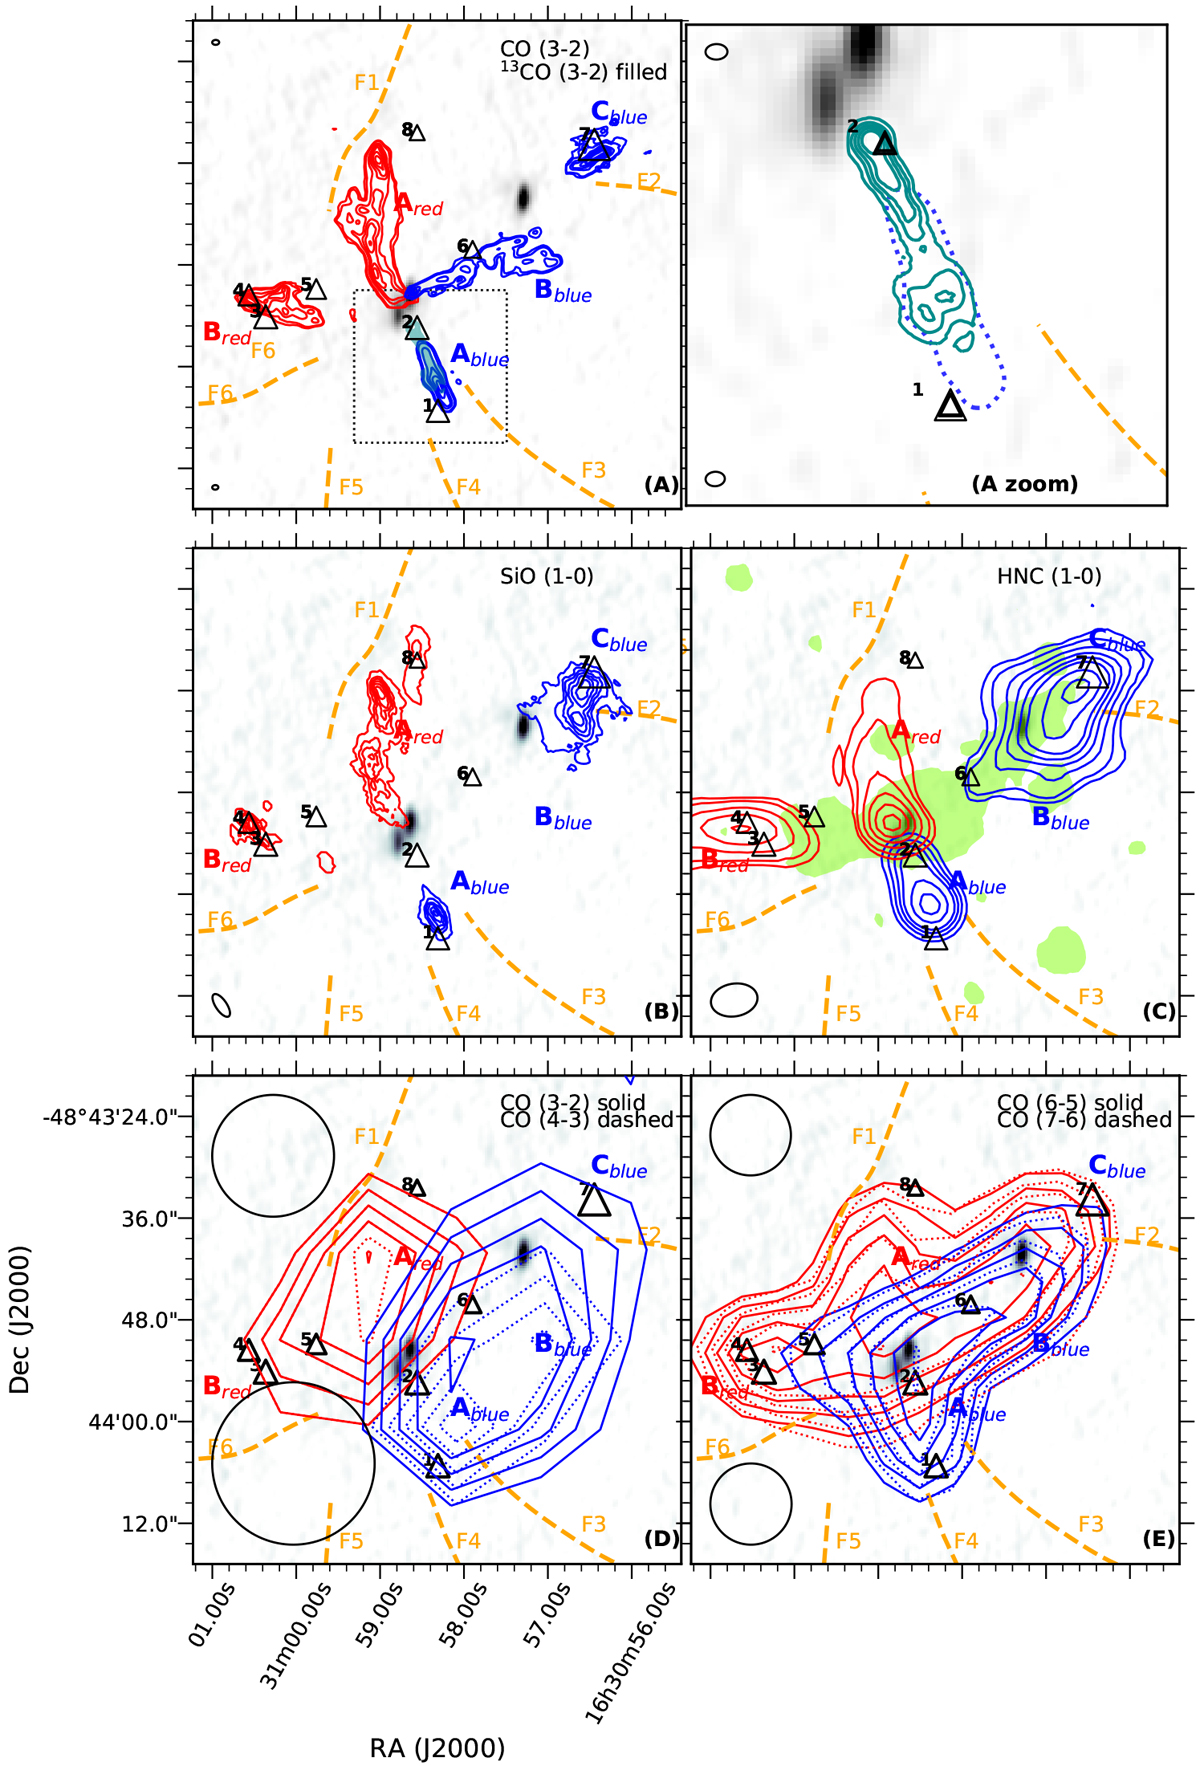
Outflows in SDC335. Each panel includes the following data of the SDC335 region. Greyscale: 8 GHz continuum emission from Paper I. Orange dashed lines: filament centroids as per Fig. 1. Triangles: class-I CH3 OH maser positions (cf. Fig. 12 and Table 7). The ellipse in the bottom left of each plot and at top left in panels (A), (D) and (E) gives observed beam shape, which are the synthesised beam widths for interferometric and the HPBW for single dish observations, respectively. Beam shape values are given in Table 1. Each panel shows the integrated red- and blue-shifted emission from the detected outflows as red and blue contours, respectively over the velocity ranges listed in Table 2. Panel A: outflows in ALMA CO(3–2), as unfilled contours, and 13CO(3–2), as filled contours, the dashed box around outflow Ablue denotes the region shown in the adjacent panel. Panel A zoom: zoom in of region bordered by the dashed box in panel A, here the 13CO(3–2) emission isshown as the solid contour at the 10, 30, 45, 60, 75 and 90% of the peak integrated emission. The 10% contour of CO(3–2) is shown as the dotted contour for comparison to panel A. Panel B: ATCA SiO(1–0) emission. Panel C: ALMA HNC(1–0) emission, this panel also includes as the filled green contour the 4.5 μm emission above above 12.5 MJy sr−1 for the EGO observed in SDC335 (Cyganowski et al. 2009). (D) APEX detected CO(4–3), as solid contours, and CO(3–2), as dashed contours, emission at 50, 60, 70, 80 and 99% of the APEX data peak emission at each frequency. (E) APEX detected CO(6–5), as solid contours, and CO(7–6), as dashed contours, emission at 50, 60, 70, 80 and 99% of the APEX data peak emission at each frequency. Panels A and B: the contour levels are at 10, 30, 45, 60, 75 and 90% of the peak emission per outflow, panel C: the contour levels are at (5), 10, 20, 30, 40, 50, 70 and 90% of the peak emission per outflow (5% contour for red lobe only, to emphasise the curvature noted in the text).
Current usage metrics show cumulative count of Article Views (full-text article views including HTML views, PDF and ePub downloads, according to the available data) and Abstracts Views on Vision4Press platform.
Data correspond to usage on the plateform after 2015. The current usage metrics is available 48-96 hours after online publication and is updated daily on week days.
Initial download of the metrics may take a while.