Open Access
Fig. A.1
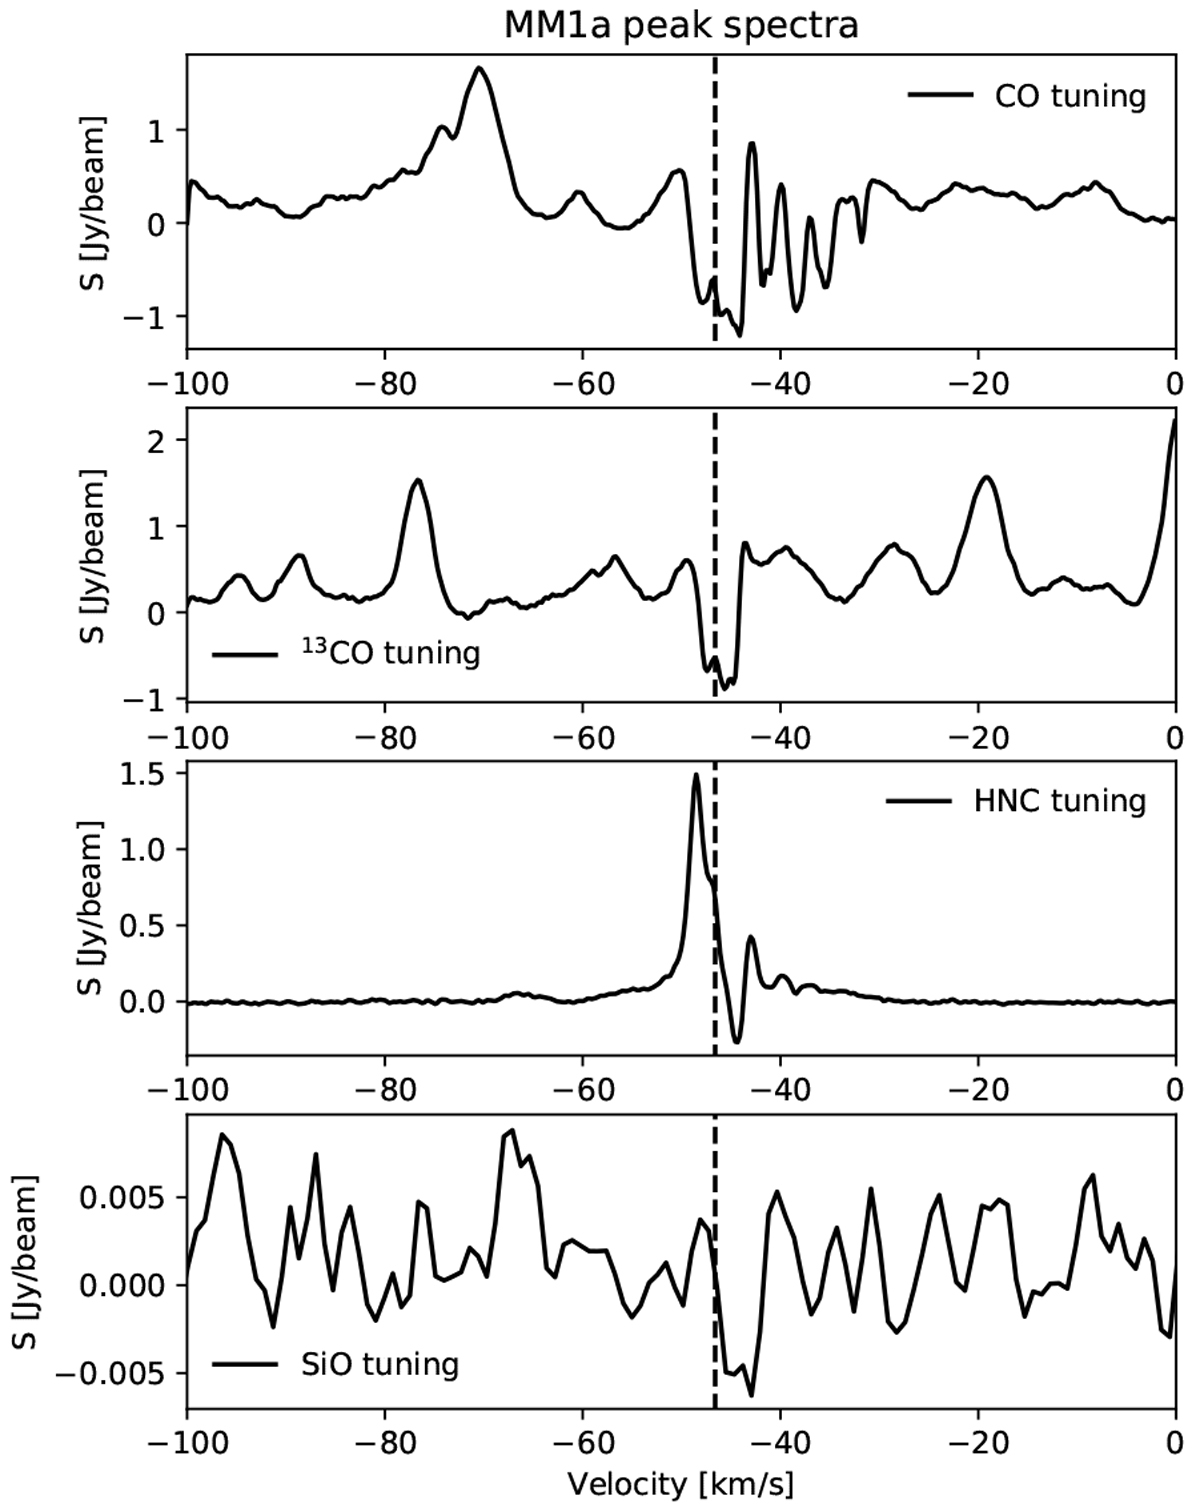
Spectra at the position of peak emission at 23 GHz (Avison et al. 2015) from the MM1a HCH II region at the same CO, 13CO, HNC, and SiO frequency tunings, as shown in Figs. 3–6. The vertical dashed line gives the Vlsr of the HCH II.
Current usage metrics show cumulative count of Article Views (full-text article views including HTML views, PDF and ePub downloads, according to the available data) and Abstracts Views on Vision4Press platform.
Data correspond to usage on the plateform after 2015. The current usage metrics is available 48-96 hours after online publication and is updated daily on week days.
Initial download of the metrics may take a while.