Fig. 17
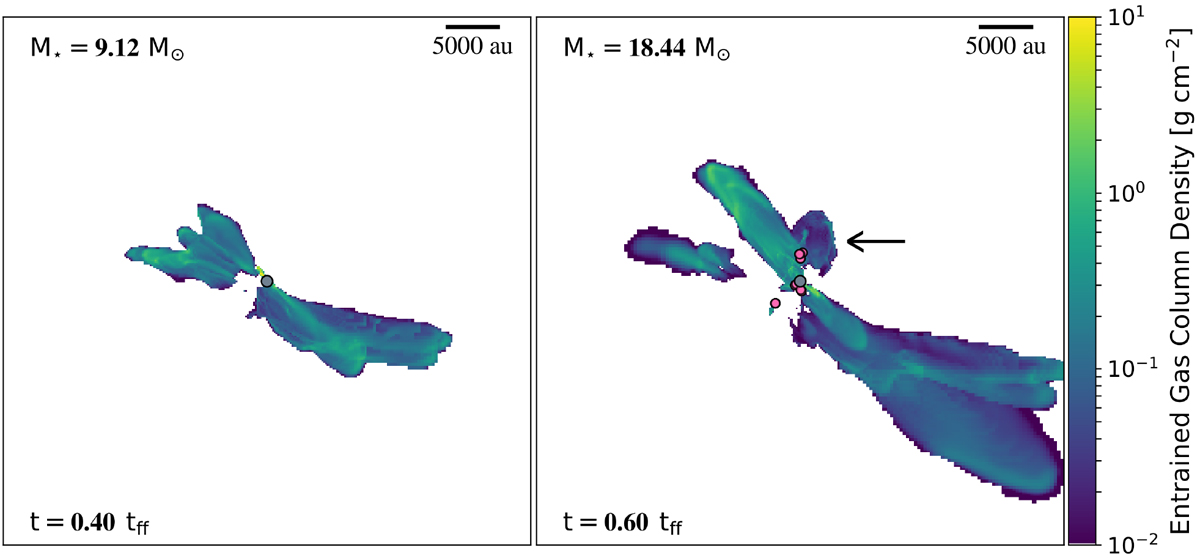
Projection plots generated from simulations of high-mass star forming regions, (adapted from Rosen & Krumholz 2020). These plots show only the material contained in the systems outflows in the condition ![]() , at two time stamps during the free fall time of the star forming core. Left: solitary massive protostar (grey circle) is seen at t = 0.4tff. This massive protostar is at the centre of up to three ‘overlapping’ outflows. These are thought to originate from the same outflow and their difference in position and angle is caused by precession of the star’s spin axis and the movement of the protostar from its birth position to its current position within the simulation. Right: at later times, t = 0.6tff, we see that lower mass protostars have formed (pink circles) and are generating their own outflows. One such outflow, denoted by the arrow, is seen to be significantly offset in angle to the primary outflow from the massive star in the region.
, at two time stamps during the free fall time of the star forming core. Left: solitary massive protostar (grey circle) is seen at t = 0.4tff. This massive protostar is at the centre of up to three ‘overlapping’ outflows. These are thought to originate from the same outflow and their difference in position and angle is caused by precession of the star’s spin axis and the movement of the protostar from its birth position to its current position within the simulation. Right: at later times, t = 0.6tff, we see that lower mass protostars have formed (pink circles) and are generating their own outflows. One such outflow, denoted by the arrow, is seen to be significantly offset in angle to the primary outflow from the massive star in the region.
Current usage metrics show cumulative count of Article Views (full-text article views including HTML views, PDF and ePub downloads, according to the available data) and Abstracts Views on Vision4Press platform.
Data correspond to usage on the plateform after 2015. The current usage metrics is available 48-96 hours after online publication and is updated daily on week days.
Initial download of the metrics may take a while.