Open Access
Fig. 15
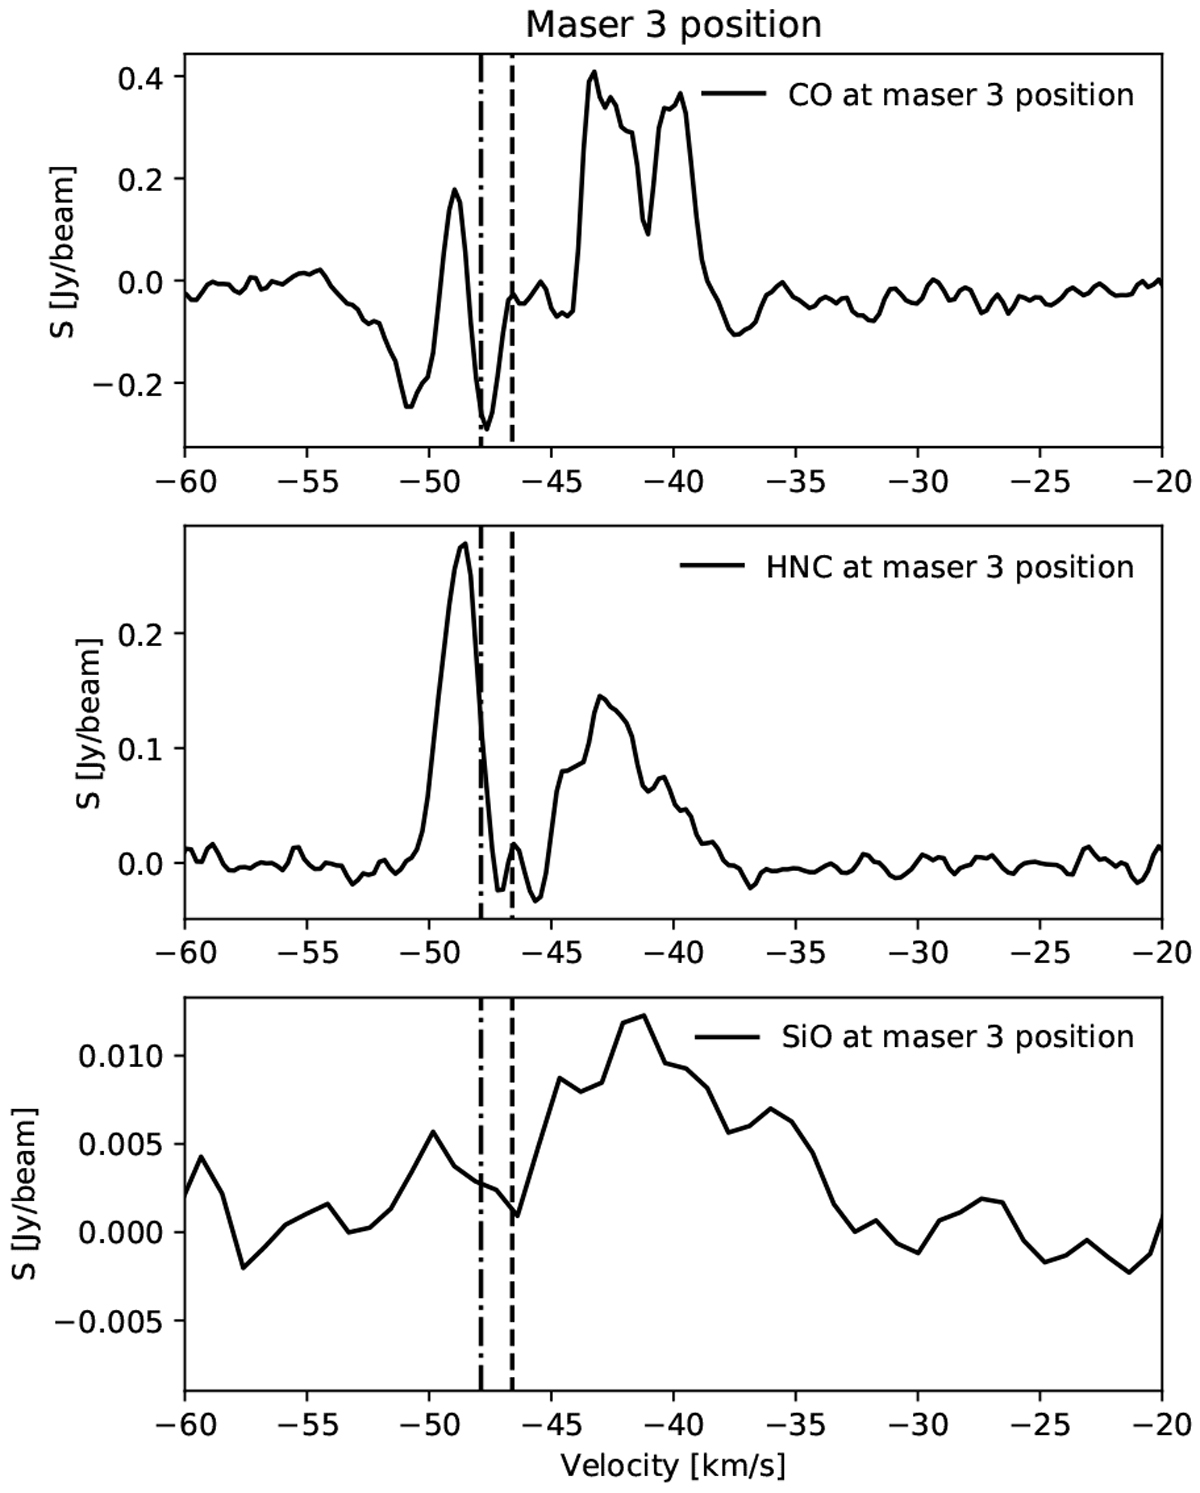
CO (ALMA), HNC and SiO spectra measured at the position of the maser 3 peak emission see Table 7. The vertical dash-dot line gives the velocity of peak emission from maser 3 and the vertical dashed line the Vlsr of the outflow driving source, MM1b.
Current usage metrics show cumulative count of Article Views (full-text article views including HTML views, PDF and ePub downloads, according to the available data) and Abstracts Views on Vision4Press platform.
Data correspond to usage on the plateform after 2015. The current usage metrics is available 48-96 hours after online publication and is updated daily on week days.
Initial download of the metrics may take a while.