Fig. 13
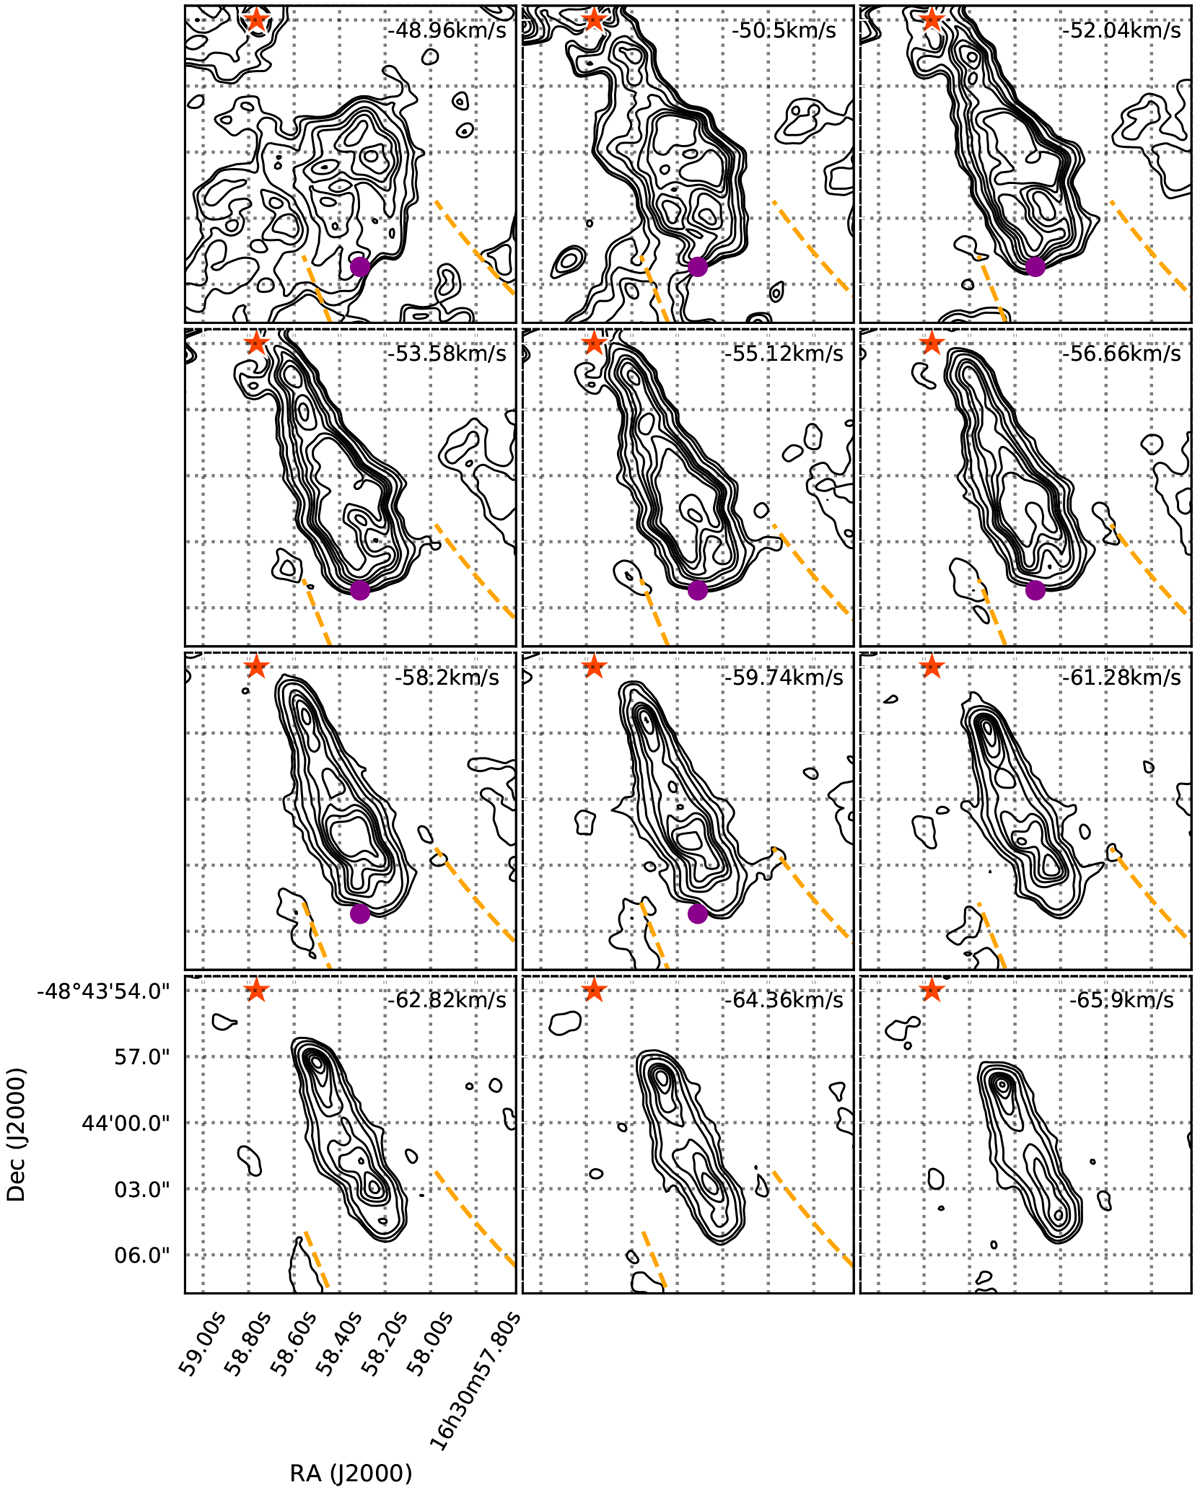
Channel map of the CO emission from the ABlue outflow. The velocity of each image is listed in the upper right corner. The position of MM1a isindicated by the red star. The purple filled circle gives the position of the Class I CH3 OH maser source 1 (see Table 7), only at velocities where the maser is present. The orange dashed lines show the fiducial directions of the F3 and F4 filaments as per Fig. 1. Contours are plotted at the 5,10, 20, 40, 50, 60, 70 and 80 σ level of the ALMA CO image (where σ = 22.0 mJy bm−1).
Current usage metrics show cumulative count of Article Views (full-text article views including HTML views, PDF and ePub downloads, according to the available data) and Abstracts Views on Vision4Press platform.
Data correspond to usage on the plateform after 2015. The current usage metrics is available 48-96 hours after online publication and is updated daily on week days.
Initial download of the metrics may take a while.