Fig. 12
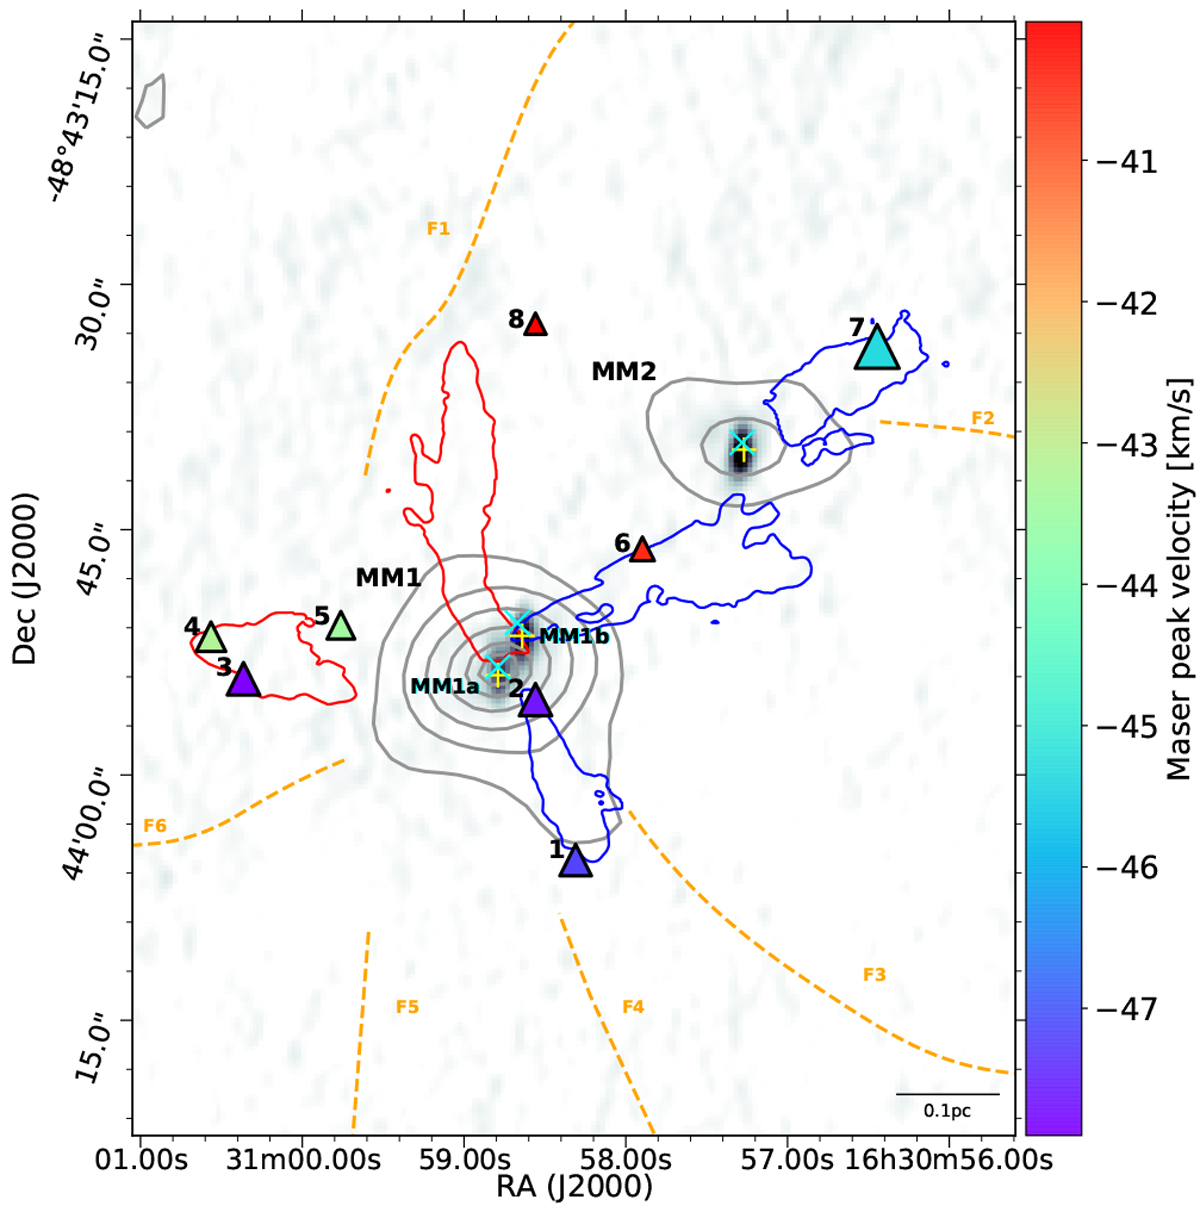
SDC335 region showing the position of the Class I methanol masers. Orange dashed lines as per Fig. 1. Filled triangles, the Class I methanol masers detected in the ATCA data, colour-coded by velocity matching that in Fig. 11, the size of the triangle is proportional to the flux density of the maser source. Cyan ‘ × ’ denote the location of Class II methanol masers at 6.7 GHz and yellow ‘+’ denote the H2O masers at 22 GHz. Grey contours show the ALMA 3 mm continuum emission and the greyscale images shows the ATCA 8 GHz continuum emission. The red and blue contours show ~ 9% of the peak integrated intensity of each of outflow, using the velocity ranges from Table 2 as a guide when comparing the maser positions.
Current usage metrics show cumulative count of Article Views (full-text article views including HTML views, PDF and ePub downloads, according to the available data) and Abstracts Views on Vision4Press platform.
Data correspond to usage on the plateform after 2015. The current usage metrics is available 48-96 hours after online publication and is updated daily on week days.
Initial download of the metrics may take a while.