Fig. 11
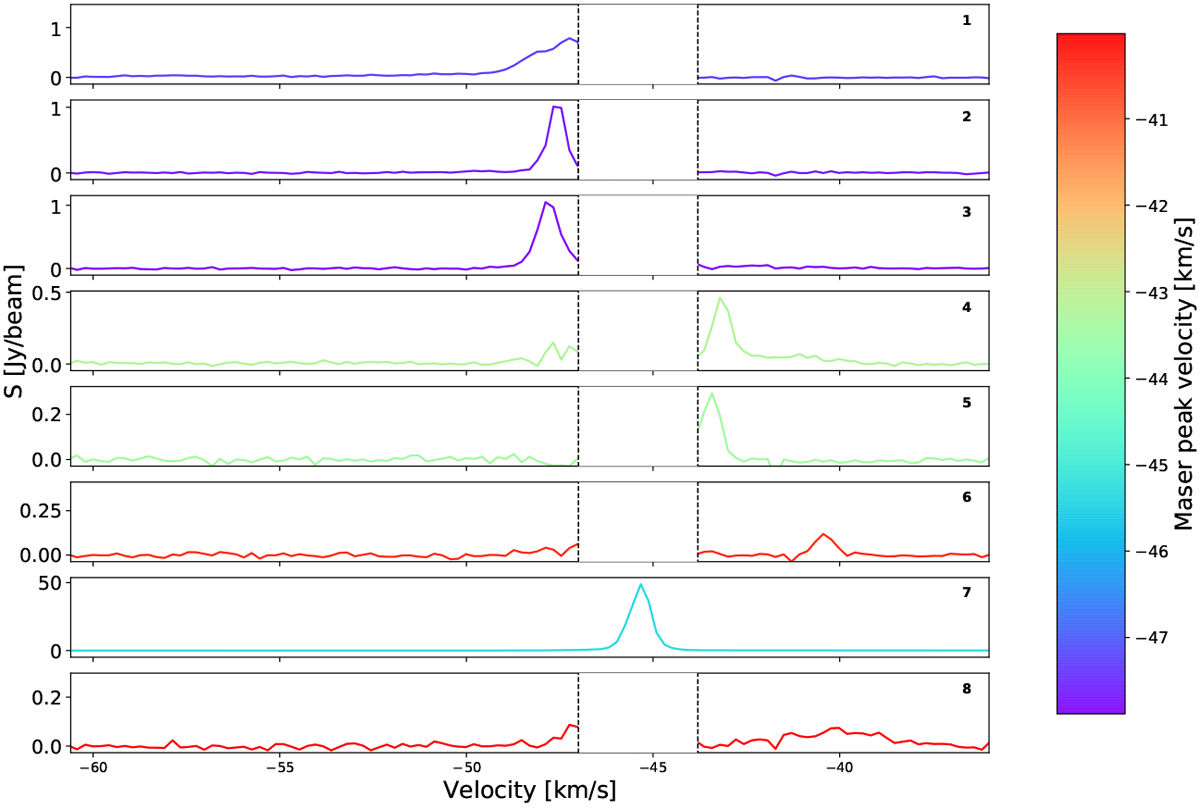
Spectra taken at the peak position of the eight Class I methanol masers observed toward SDC335. Each panel gives the spectra of an individual maser spot (numbered in the upper right of the panel). Each spectra is colour coded by its peak velocity following the colour bar (right). The y-axis for each spectrum differs and is scaled to between −0.1 × and 1.1 × the peak flux density of the individual maser as listed in Table 7. The velocity range − 47.0 to − 43.8 km s−1 is blanked outin panels 1–6 and 8 as between these velocities the spectra of these masers are dominated by imaging artefacts caused by the strong emission from maser 7. This is to avoid confusion between true maser emission and imaging artefacts.
Current usage metrics show cumulative count of Article Views (full-text article views including HTML views, PDF and ePub downloads, according to the available data) and Abstracts Views on Vision4Press platform.
Data correspond to usage on the plateform after 2015. The current usage metrics is available 48-96 hours after online publication and is updated daily on week days.
Initial download of the metrics may take a while.