Fig. 10
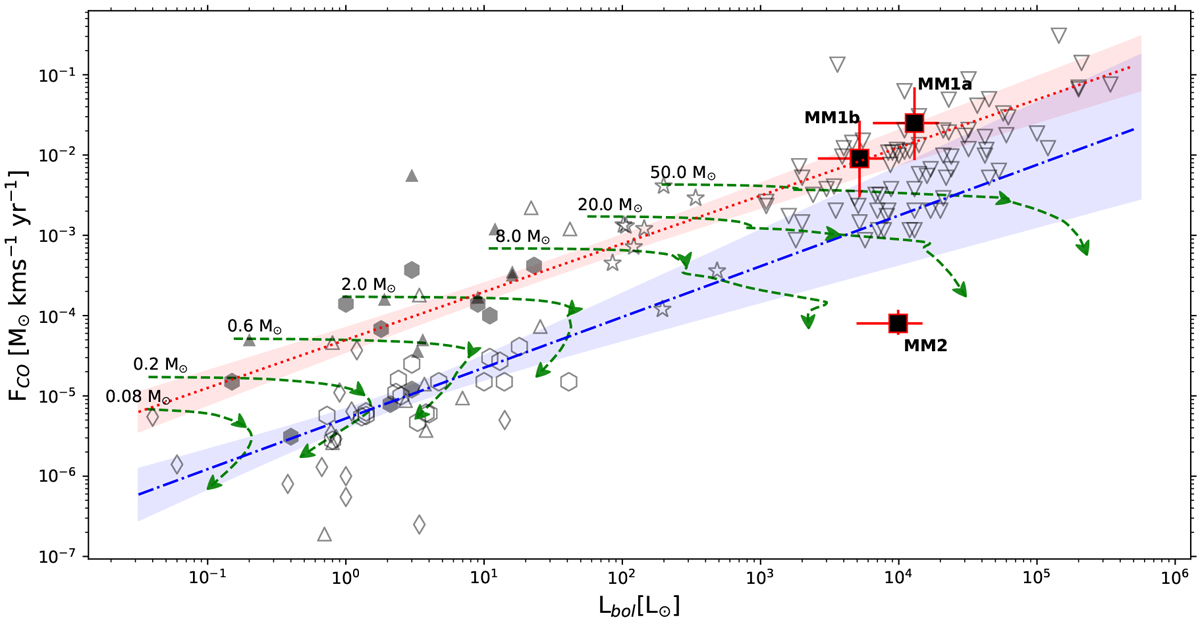
Outflow momentum flux, FCO, as a functionof powering source bolometric luminosity Lbol. Data for outflows A, B, and C in SDC335 are indicated by the filled squares and associated errorbars. The origin of the errorbars are discussed in the main text. The filled and empty hexagons are the Class 0 and Class I low-mass protostars from Bontemps et al. (1996). The diamonds are low-mass Class I sources from observation of Ophiuchus (van der Marel et al. 2013). Filled and empty triangles are literature values for Class 0 and I objects used by van der Marel et al. (2013, see their Table E.1). The stars denote the Duarte-Cabral et al. (2013) high-mass Class 0 analogues and the triangles are outflows from high-mass protostellar objects observed from the RMS survey (Maud et al. 2015). The green dashed tracks with arrow heads are the evolutionary tracks for decreasing or intermittentaccretion from Duarte-Cabral et al. (2013). The arrow heads represent the point at which a protostar of a given mass (given at the end of the arrow) has accreted 50 and 90% of their envelope mass. Red dotted line is the best fit to the plotted Class 0 sources extended to high luminosity with the red shaded region given the 1-σ error margin for this fit. The blue dashed-dot line and shaded region are the same but for the best fit to the plotted Class I sources.
Current usage metrics show cumulative count of Article Views (full-text article views including HTML views, PDF and ePub downloads, according to the available data) and Abstracts Views on Vision4Press platform.
Data correspond to usage on the plateform after 2015. The current usage metrics is available 48-96 hours after online publication and is updated daily on week days.
Initial download of the metrics may take a while.