Fig. 1
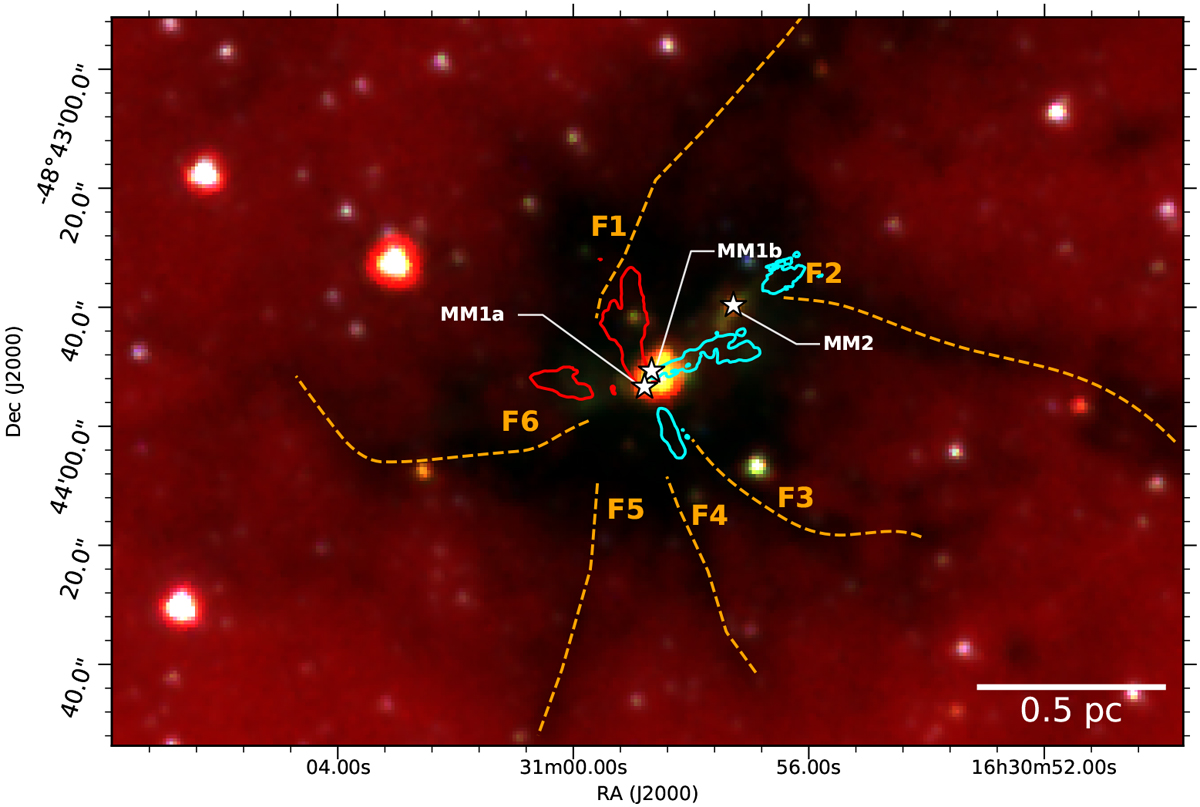
Three colour image of SDC335 overlaid with ALMA CO contours highlighting three potential outflows within the cloud. Colour scale: Spitzer GLIMPSE three colour image with red, green and blue using 8.0, 4.5 and 3.6 μm respectively. Cyan and red contours: ALMA CO(3–2) integrated images showing the extent and morphology of the three potential outflows in the region with contours at ~ 9% to highlight their extent. The white ⋆ denote the locations of Class II CH3OH masers associated with the MM1a, MM1b and MM2 compact radio cores (Paper I). Orange dashed lines: nominal centroid positions of the six filaments seen in SDC335 (cf. Peretto et al. 2013).
Current usage metrics show cumulative count of Article Views (full-text article views including HTML views, PDF and ePub downloads, according to the available data) and Abstracts Views on Vision4Press platform.
Data correspond to usage on the plateform after 2015. The current usage metrics is available 48-96 hours after online publication and is updated daily on week days.
Initial download of the metrics may take a while.