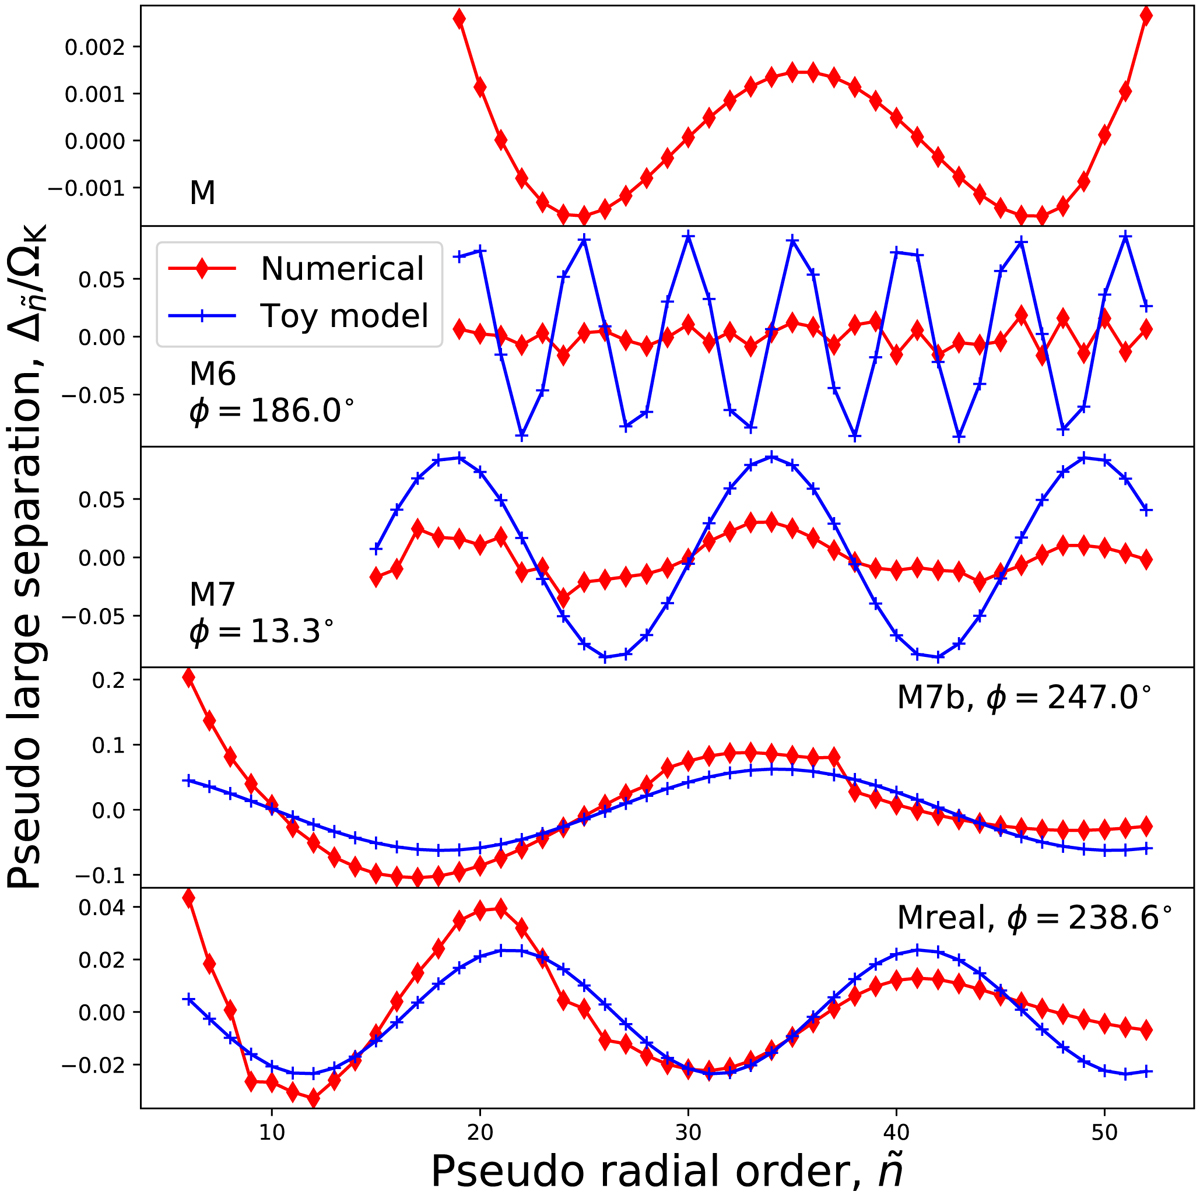
Fig. 14.
Frequencies of the ![]() modes after subtraction of a third-order polynomial fit (or second order polynomial fit in the case M7b) versus the predicted glitch from the toy model. Each panel corresponds to a different model. An ad hoc phase, the value of which is indicated in each panel, has been added to the toy model to improve the agreement.
modes after subtraction of a third-order polynomial fit (or second order polynomial fit in the case M7b) versus the predicted glitch from the toy model. Each panel corresponds to a different model. An ad hoc phase, the value of which is indicated in each panel, has been added to the toy model to improve the agreement.
Current usage metrics show cumulative count of Article Views (full-text article views including HTML views, PDF and ePub downloads, according to the available data) and Abstracts Views on Vision4Press platform.
Data correspond to usage on the plateform after 2015. The current usage metrics is available 48-96 hours after online publication and is updated daily on week days.
Initial download of the metrics may take a while.