Fig. 12.
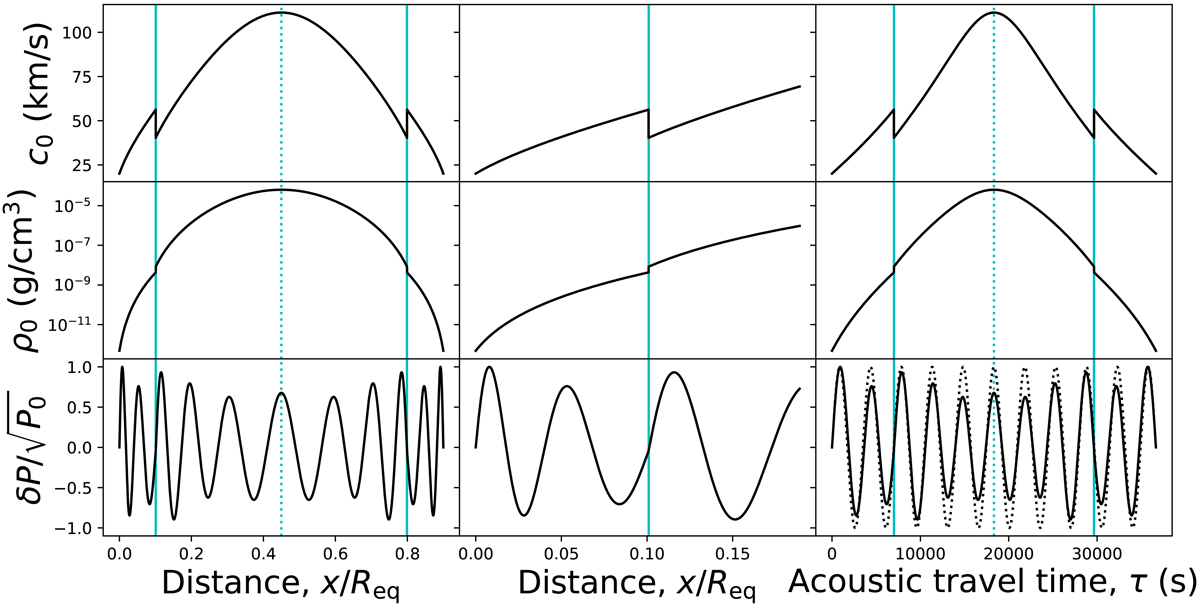
Sound velocity (first row), density (second row), and perturbed pressure (![]() , third row) profiles as a function of distance (first and second columns) and acoustic travel time (third column) along island periodic orbit. The second column is a zoom of the first column around the first discontinuity. The vertical light blue solid lines indicate the discontinuity and the vertical light blue dotted lines correspond to the equator. The dotted curve in the lower right panel is a simple sine curve with the same periodicity as the mode.
, third row) profiles as a function of distance (first and second columns) and acoustic travel time (third column) along island periodic orbit. The second column is a zoom of the first column around the first discontinuity. The vertical light blue solid lines indicate the discontinuity and the vertical light blue dotted lines correspond to the equator. The dotted curve in the lower right panel is a simple sine curve with the same periodicity as the mode.
Current usage metrics show cumulative count of Article Views (full-text article views including HTML views, PDF and ePub downloads, according to the available data) and Abstracts Views on Vision4Press platform.
Data correspond to usage on the plateform after 2015. The current usage metrics is available 48-96 hours after online publication and is updated daily on week days.
Initial download of the metrics may take a while.