Fig. 8.
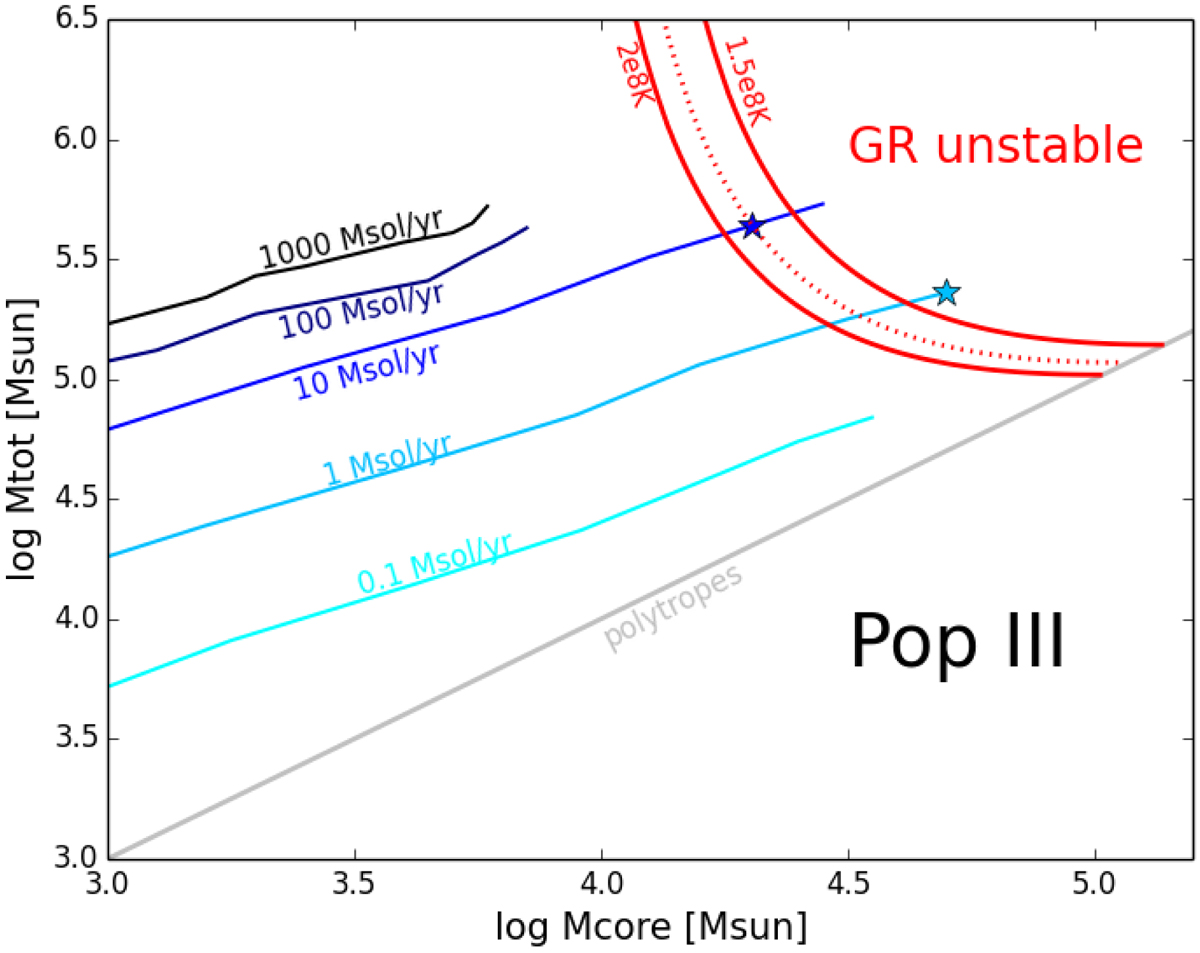
Total mass of the star versus mass of the convective core in the Pop III case. Solid red lines indicate the limit of stability for hylotropic models with μ = 0.6 and Tc = 1.5−2 × 10⁸ K. The GENEC models of Haemmerlé et al. (2018a, 2019) at zero metallicity are plotted with the indicated rates. The identity corresponds to polytropes of different masses, and is shown as a grey line. The final masses obtained in Haemmerlé (2020) are marked by star-like symbols. The dotted red line is the limit of stability for hylotropes with μ = 0.6 and the exact central temperature of the GENEC model at 10 M⊙ yr−1 at the onset of instability (Tc = 1.78 × 10⁸ K).
Current usage metrics show cumulative count of Article Views (full-text article views including HTML views, PDF and ePub downloads, according to the available data) and Abstracts Views on Vision4Press platform.
Data correspond to usage on the plateform after 2015. The current usage metrics is available 48-96 hours after online publication and is updated daily on week days.
Initial download of the metrics may take a while.