Fig. 1.
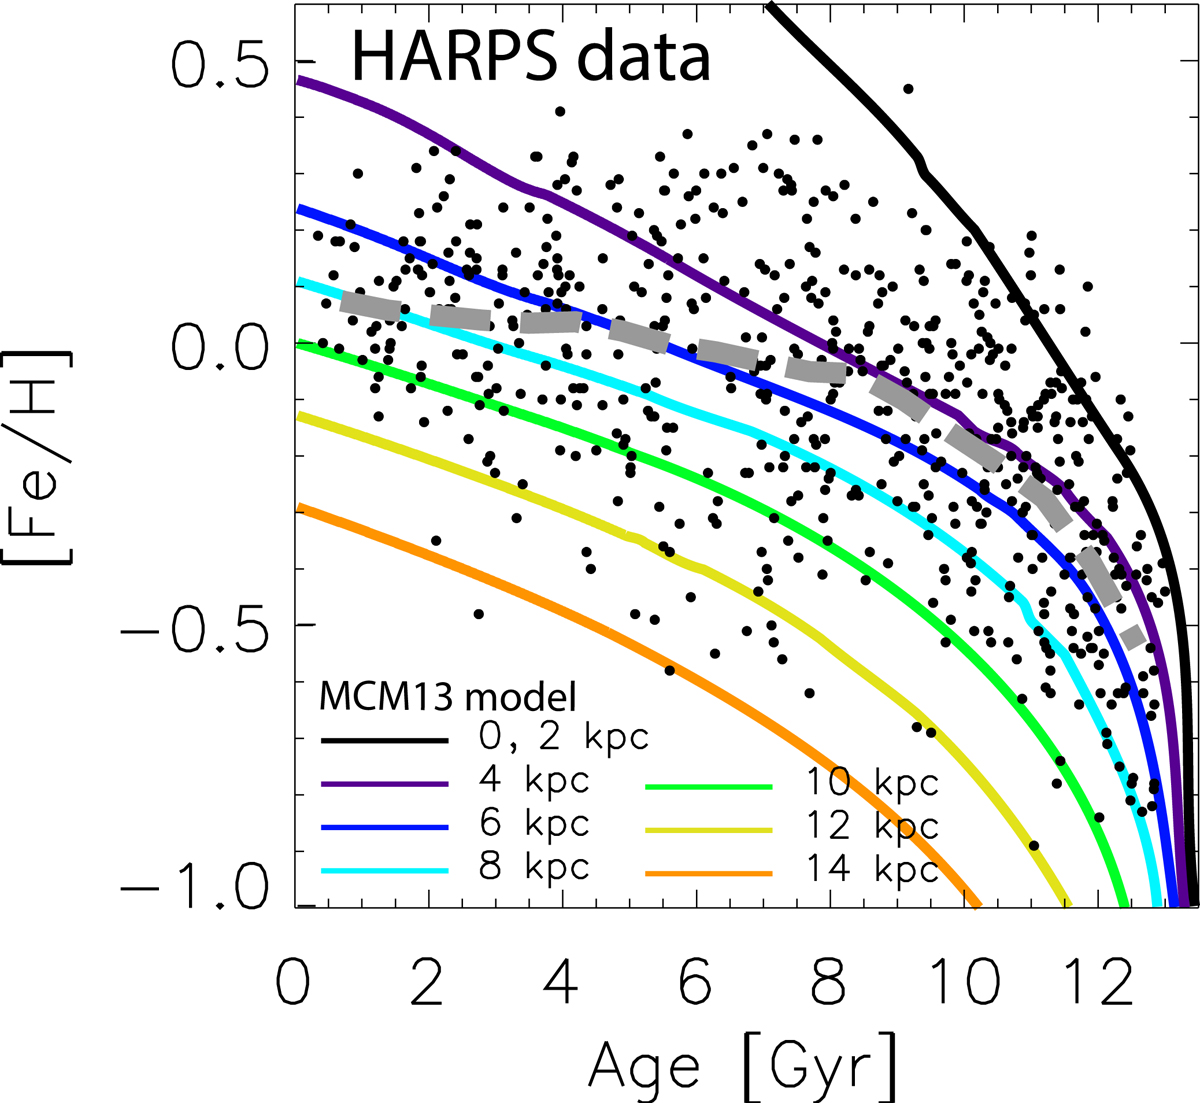
Scatter points are HARPS CTO data (recently reanalyzed data by Delgado Mena et al. 2017 and age estimates by Anders et al. 2018), which represent the AMR in the Galaxy. The dashed gray line shows the average of the total sample, which appears flat in the last ∼5 Gyr. The color-coded curves indicate averages of subsamples according to their birth locations from the MCM13 model. The apparent flatness in the local AMR can be explained by the superposition of well-defined AMRs of stars born in narrow birth-radius bins.
Current usage metrics show cumulative count of Article Views (full-text article views including HTML views, PDF and ePub downloads, according to the available data) and Abstracts Views on Vision4Press platform.
Data correspond to usage on the plateform after 2015. The current usage metrics is available 48-96 hours after online publication and is updated daily on week days.
Initial download of the metrics may take a while.