Free Access
Fig. 5
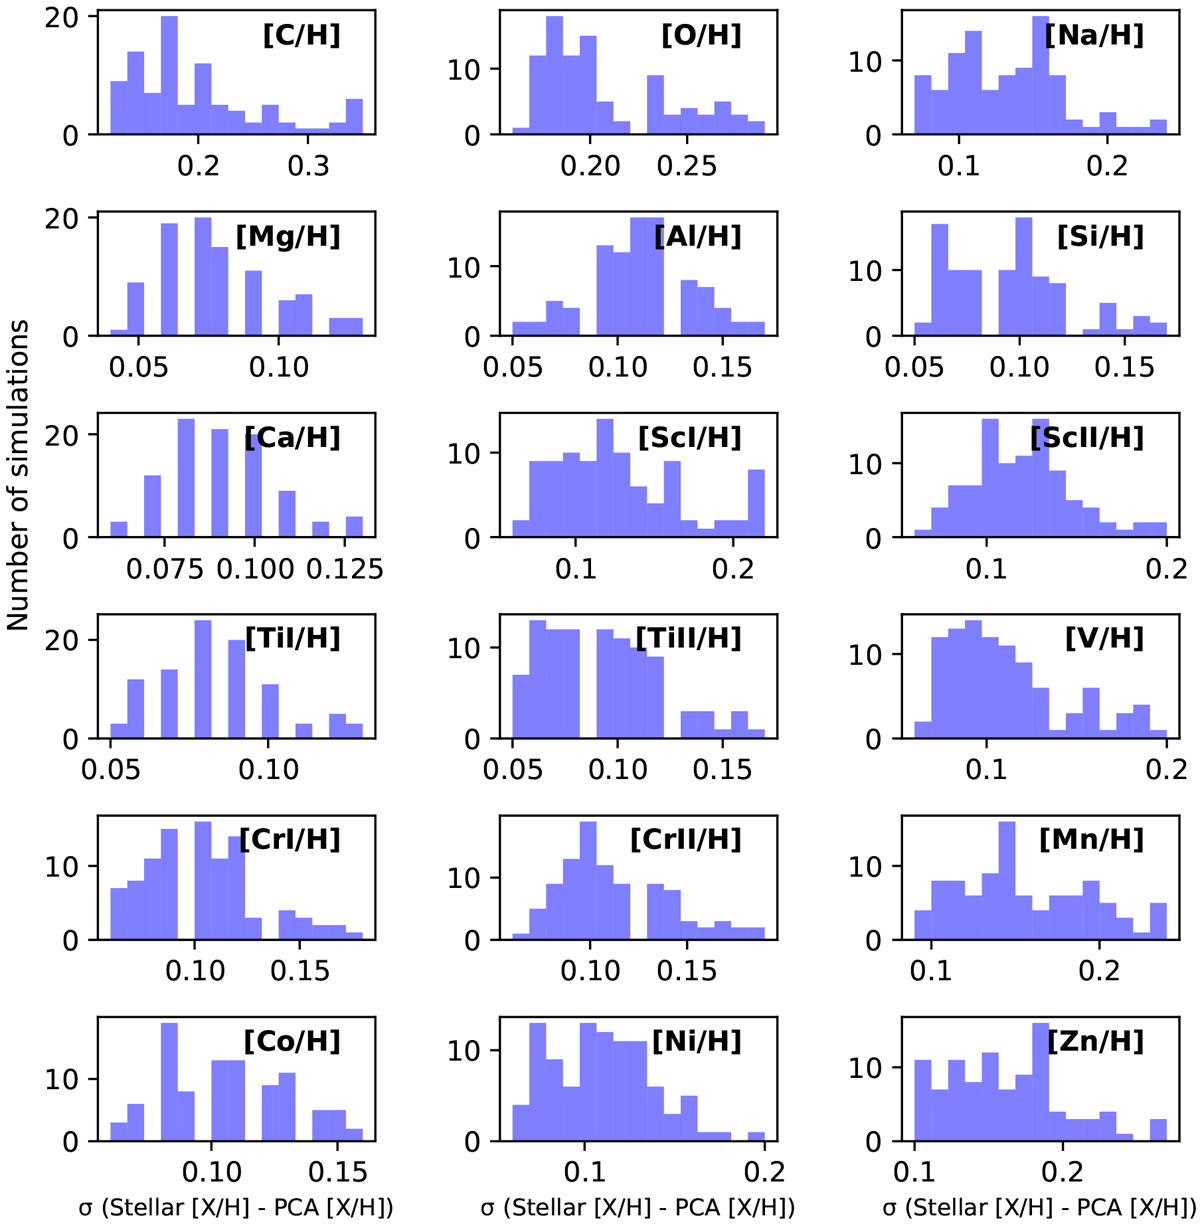
Obtained standard deviations of the differences between the PCA-derived abundances and the measured stellar abundances for our sample of FGK stars with HARPS/-N spectra. The histograms show the results from 100 simulations. Outliers are excluded from the plot.
Current usage metrics show cumulative count of Article Views (full-text article views including HTML views, PDF and ePub downloads, according to the available data) and Abstracts Views on Vision4Press platform.
Data correspond to usage on the plateform after 2015. The current usage metrics is available 48-96 hours after online publication and is updated daily on week days.
Initial download of the metrics may take a while.