Free Access
Fig. 2
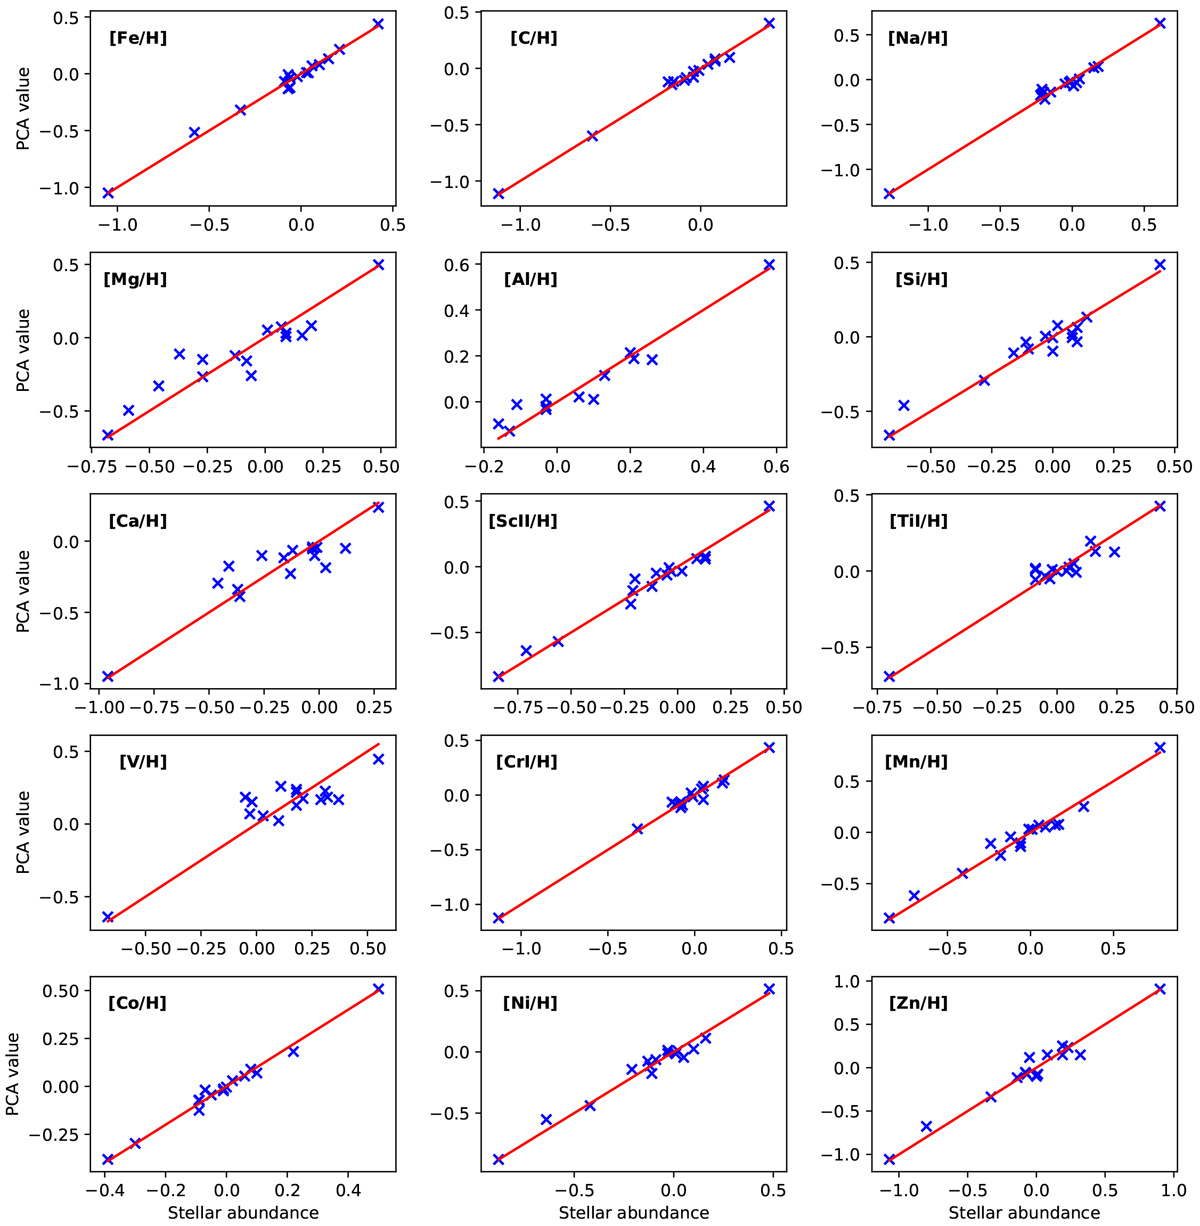
Stellar abundances, [X/H], derived for the M dwarfs included in the training dataset using our PCA–Bayes technique versus the abundances measured in the corresponding primary stars. The red line denotes the one-to-one relationship.
Current usage metrics show cumulative count of Article Views (full-text article views including HTML views, PDF and ePub downloads, according to the available data) and Abstracts Views on Vision4Press platform.
Data correspond to usage on the plateform after 2015. The current usage metrics is available 48-96 hours after online publication and is updated daily on week days.
Initial download of the metrics may take a while.