Free Access
Fig. A.1
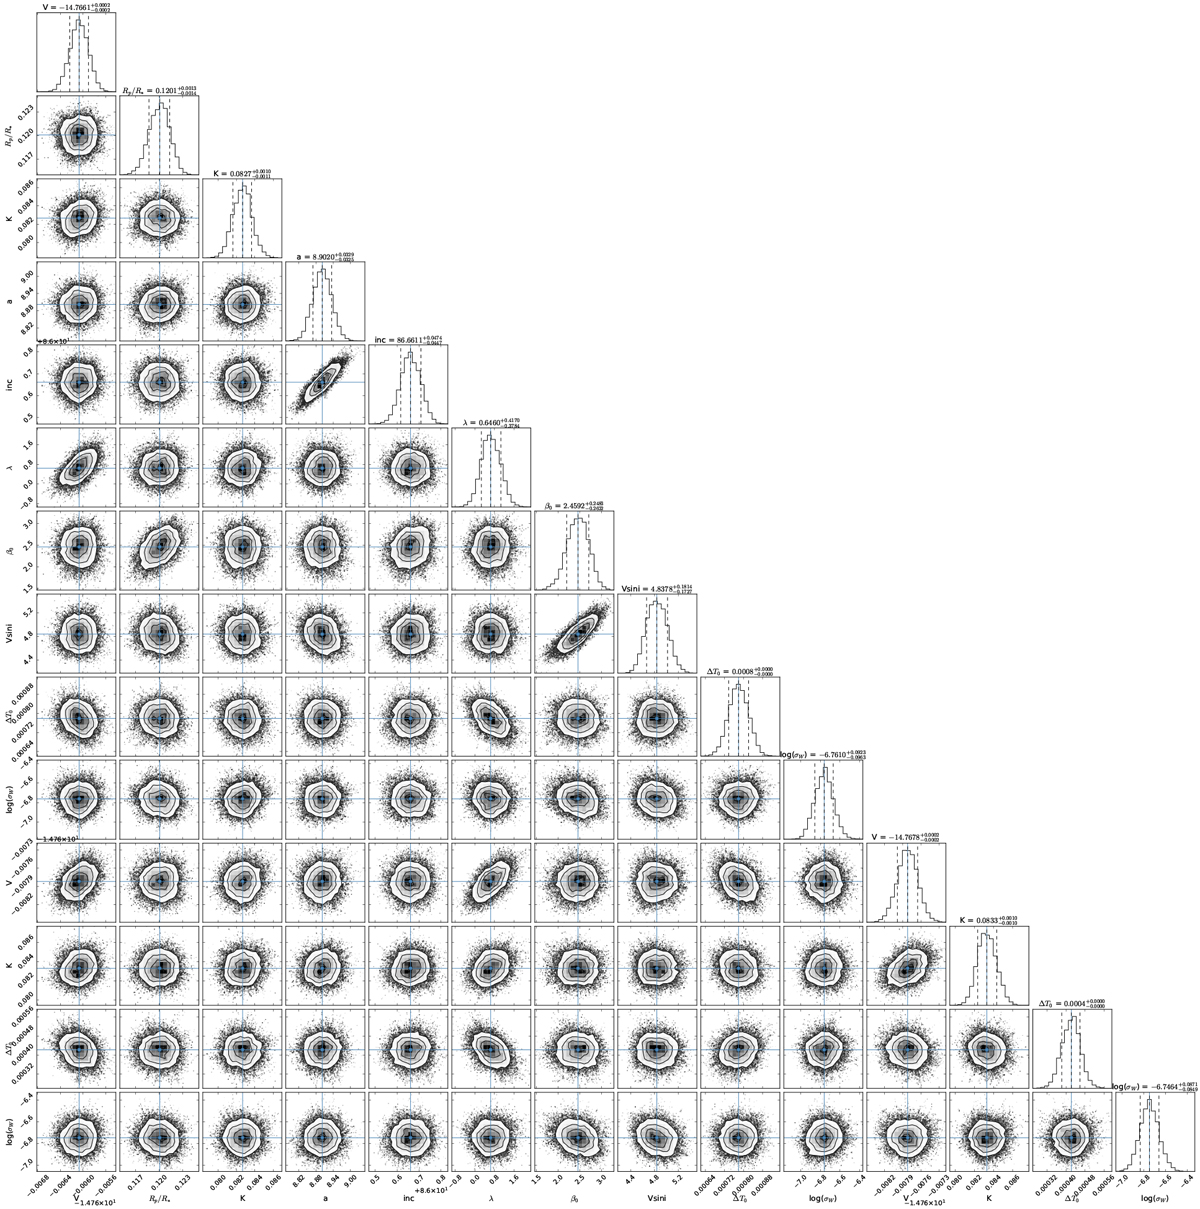
Corner plot of white-light fit to the two transits. The values and error bars represent the median and 1-sigma uncertainty based on the posterior distributions. The lower right plots for Vsys, Δϕ0, K, and σW concern the second transit.
Current usage metrics show cumulative count of Article Views (full-text article views including HTML views, PDF and ePub downloads, according to the available data) and Abstracts Views on Vision4Press platform.
Data correspond to usage on the plateform after 2015. The current usage metrics is available 48-96 hours after online publication and is updated daily on week days.
Initial download of the metrics may take a while.