Fig. 7
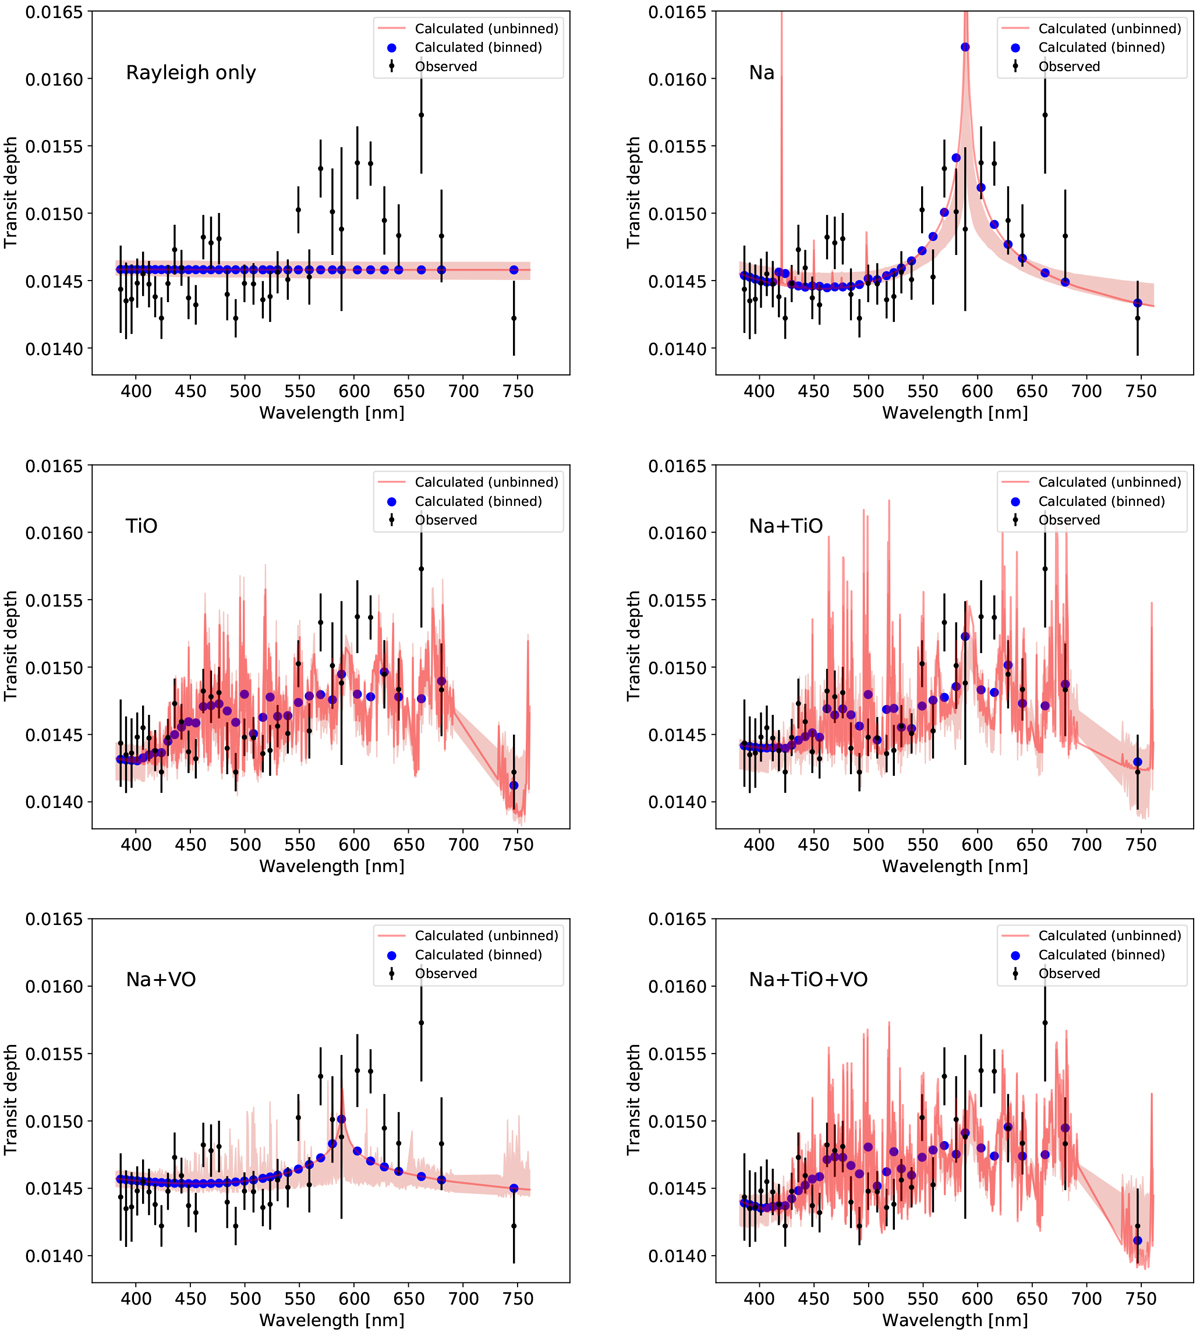
Comparison of our transmission spectrum with synthetic models computed using PLATON. Top: model with “no elements” (left) and with only Na absorption (right). Middle: models with only TiO (left) and with Na + TiO (right). Bottom: models with Na + VO (left) and with all Na, VO, and TiO (right). In all plots, the observational points are denoted in black, with the respective error bars. The red line denotes the best high-spectral resolution model, while the blue points represent its wavelength binned version at the same resolution as the observations. The red shaded area represents the sixteenth and eighty-fourth percentiles of the models.
Current usage metrics show cumulative count of Article Views (full-text article views including HTML views, PDF and ePub downloads, according to the available data) and Abstracts Views on Vision4Press platform.
Data correspond to usage on the plateform after 2015. The current usage metrics is available 48-96 hours after online publication and is updated daily on week days.
Initial download of the metrics may take a while.