Fig. 4
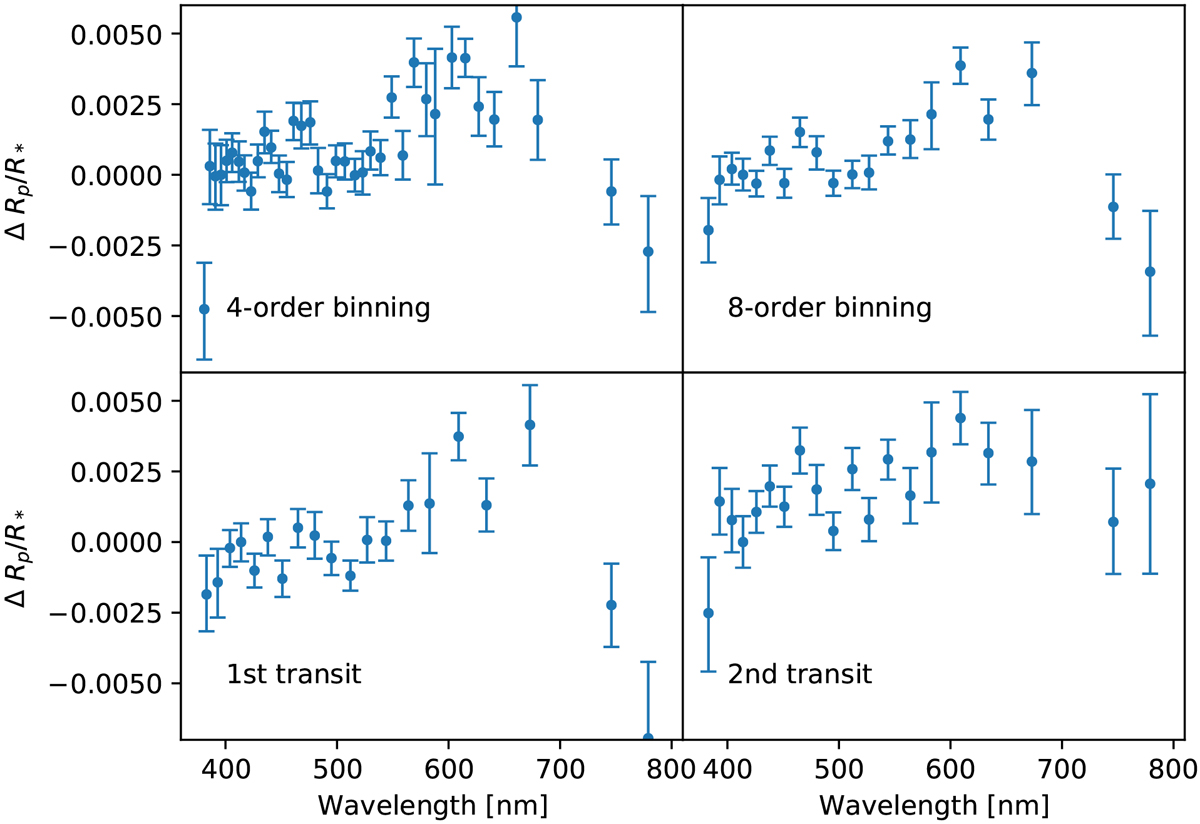
Transmission spectrum of HD 209458 as obtained from the analysis of the chromatic RM curves. The two upper panels showthe combined analysis of the two transits with four- and eight-slice binnings, respectively, for the left and right panels. The two lower panels present the analysis of the two transits separately as computed with an eight-slice binning.
Current usage metrics show cumulative count of Article Views (full-text article views including HTML views, PDF and ePub downloads, according to the available data) and Abstracts Views on Vision4Press platform.
Data correspond to usage on the plateform after 2015. The current usage metrics is available 48-96 hours after online publication and is updated daily on week days.
Initial download of the metrics may take a while.