Free Access
Fig. 3
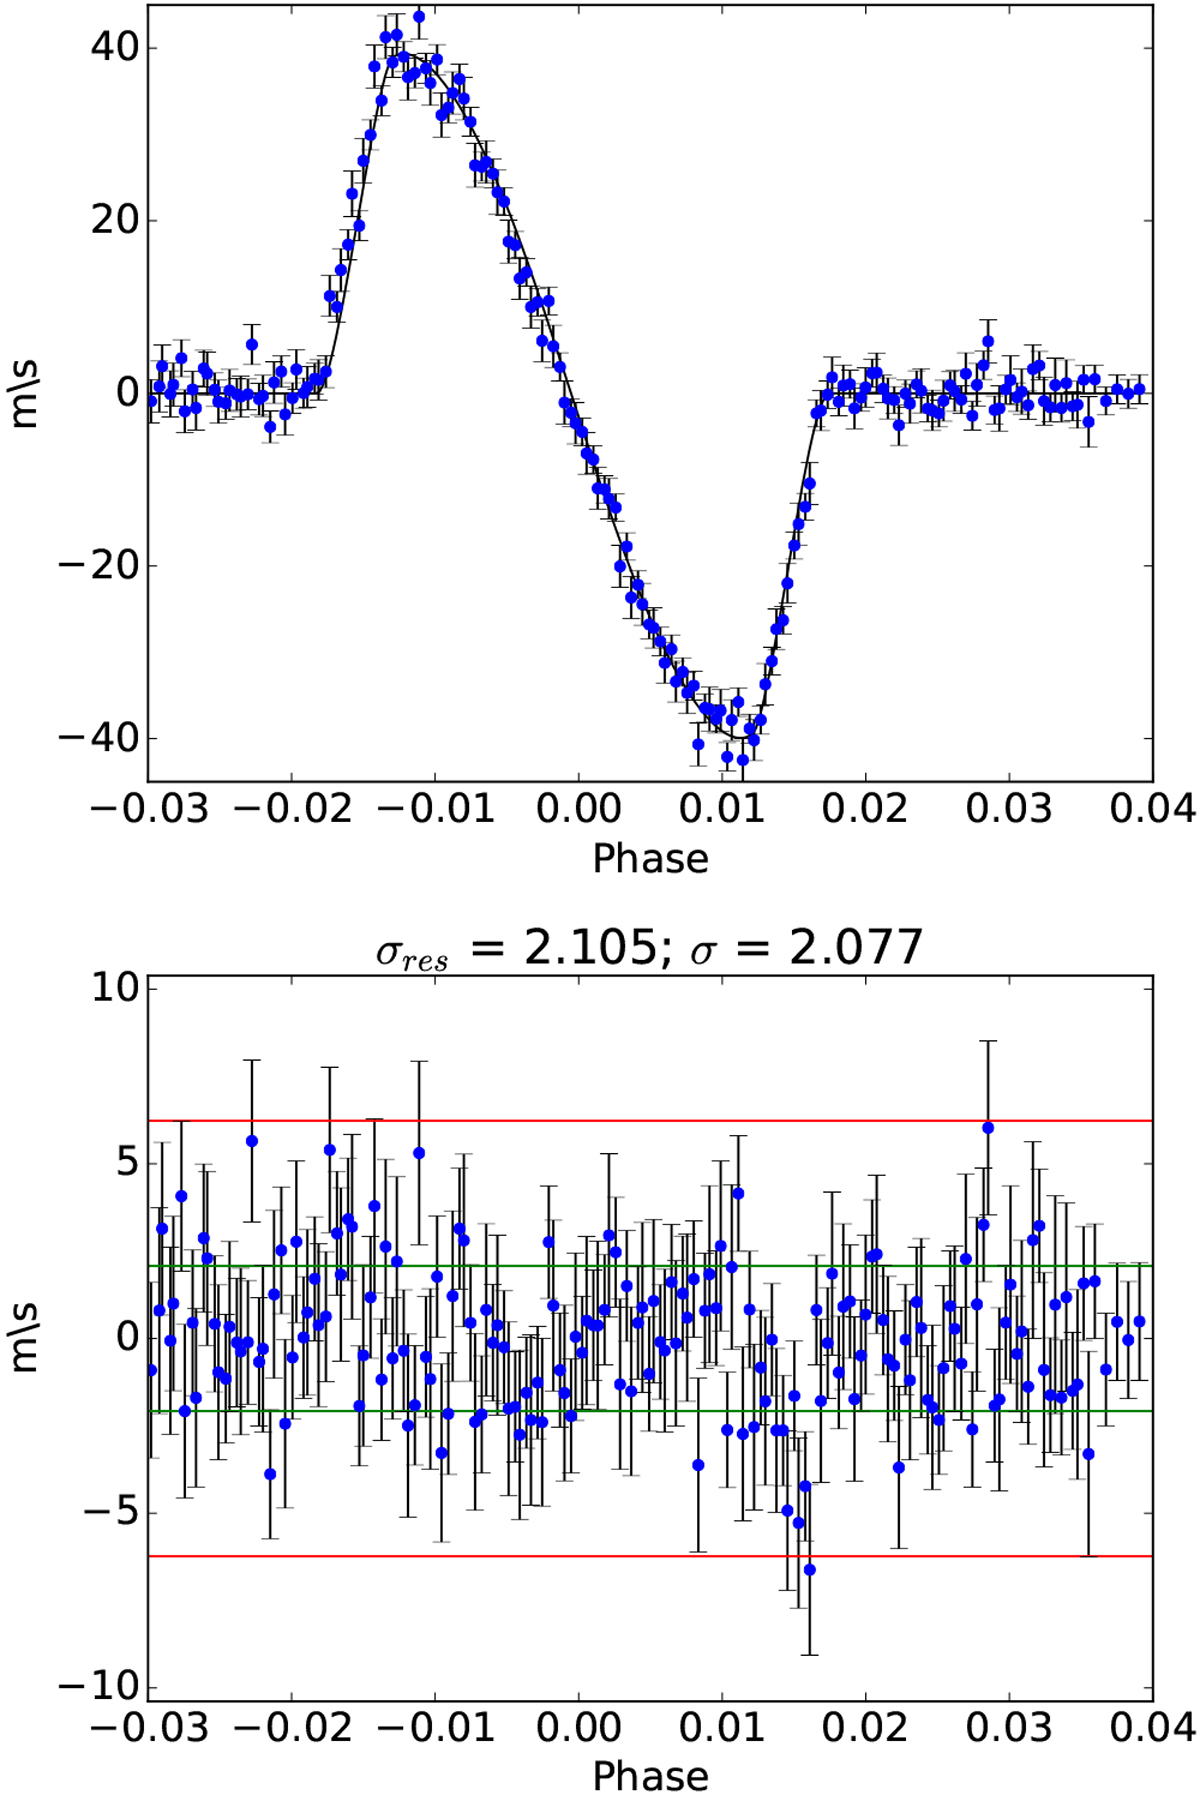
Rossiter–McLaughlin fit to observed signal at 512 nm (top) and residuals (bottom). Data from both transits are phase folded. The Keplerian function was subtracted from the data.
Current usage metrics show cumulative count of Article Views (full-text article views including HTML views, PDF and ePub downloads, according to the available data) and Abstracts Views on Vision4Press platform.
Data correspond to usage on the plateform after 2015. The current usage metrics is available 48-96 hours after online publication and is updated daily on week days.
Initial download of the metrics may take a while.