Fig. A.4.
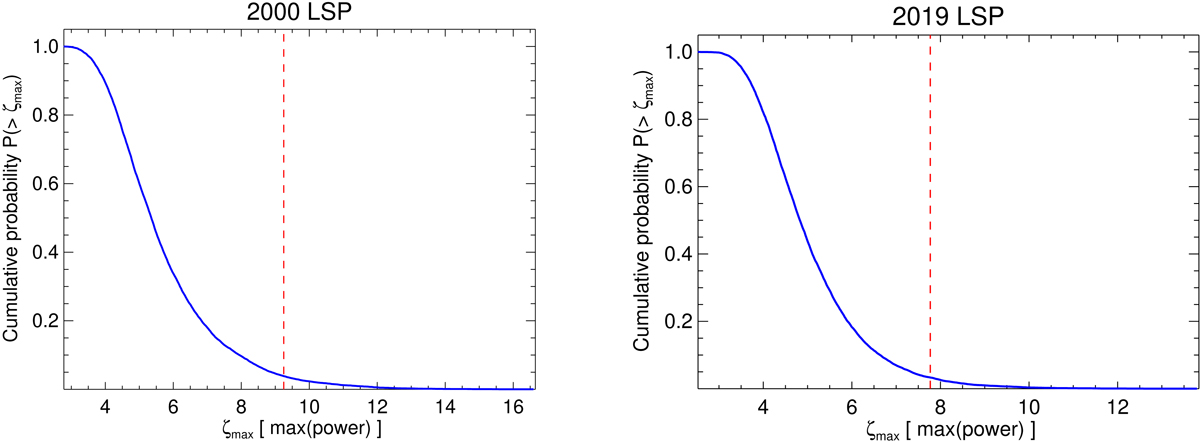
Left: cumulative distribution of global chance probability of the maximum LSP power (ζmax) searched in the given frequency range of interest (1.2 × 10⁻⁴ − 5.1 × 10⁻³ Hz). The probability P(> ζmax) is calculated as the values exceeding a given maximum power. The red vertical line represents the probability of maximum LSP power exceeding the observed QPO value, ζmax, obs = 9.25 for the XMM2000 data, which corresponds to a global statistical significance of 96.81% for the QPO detection. Right: same as left, but for the simulations of XMM2019 data.
Current usage metrics show cumulative count of Article Views (full-text article views including HTML views, PDF and ePub downloads, according to the available data) and Abstracts Views on Vision4Press platform.
Data correspond to usage on the plateform after 2015. The current usage metrics is available 48-96 hours after online publication and is updated daily on week days.
Initial download of the metrics may take a while.