Fig. A.3.
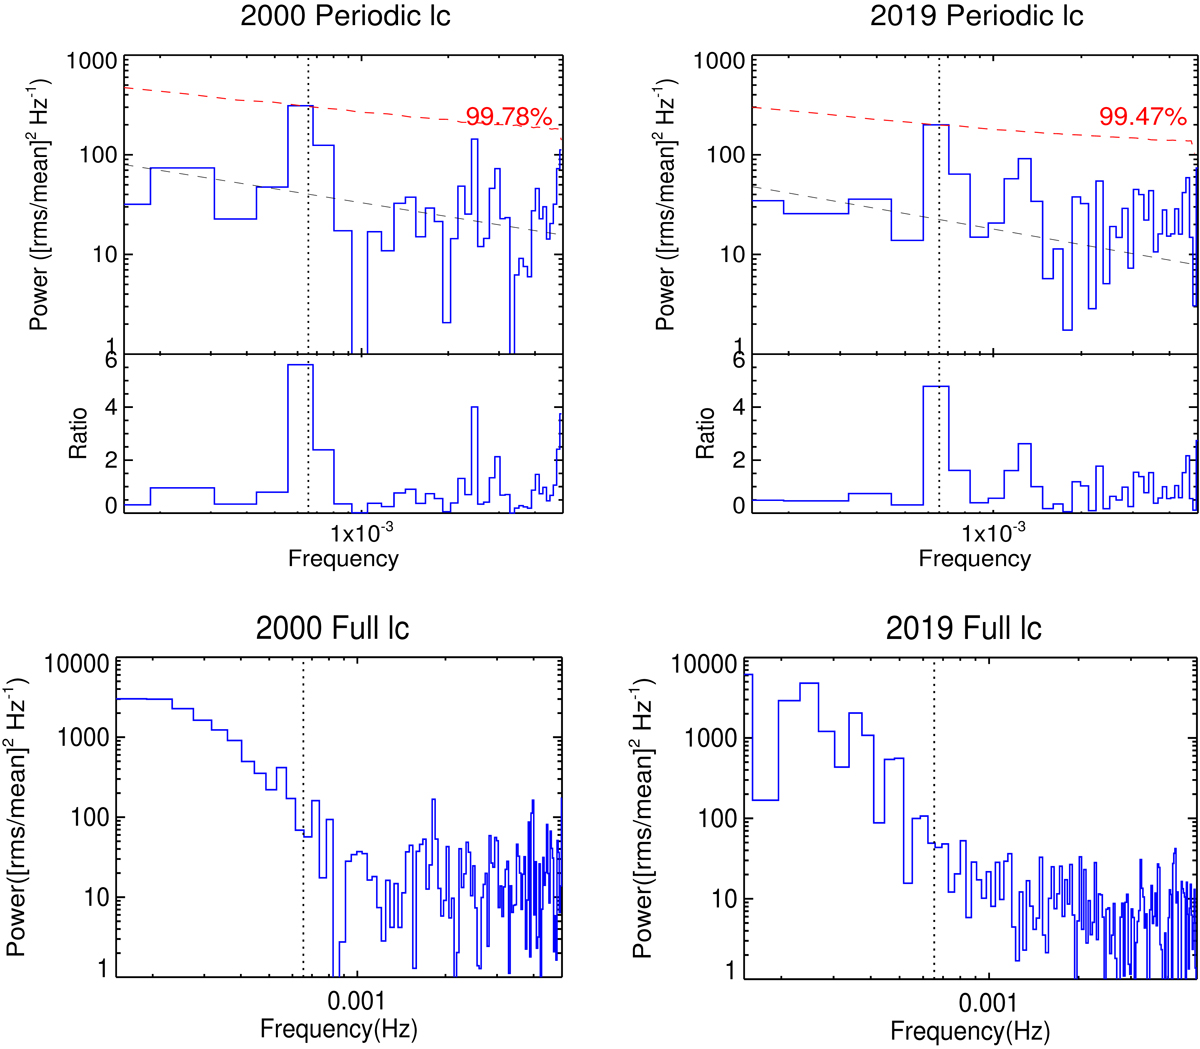
PSD calculated as the modulus-squared of the DFT, which is normalized with [rms/mean]2. Top panel: PSD of light curve from the periodic segment (XMM2000 data on left and XMM2019 data on right). The red dashed line shows the single-trial 99.78% significance curve, while the black dashed line shows the best-fitted PSD model with a powerlaw plus constant (P(f) = Nf−α + C). The corresponding data/model ratios are shown in the lower panel. The vertical line marks the QPO frequency found from the LSP and WWZ analyses (see text). Bottom panel: PSD for the full light curve of two XMM observations where no QPO is seen at the frequency of ∼6.7 × 10⁻⁴ Hz.
Current usage metrics show cumulative count of Article Views (full-text article views including HTML views, PDF and ePub downloads, according to the available data) and Abstracts Views on Vision4Press platform.
Data correspond to usage on the plateform after 2015. The current usage metrics is available 48-96 hours after online publication and is updated daily on week days.
Initial download of the metrics may take a while.